vscsiStats Excel Macro for Automated Charts
Navigating through some VDI related posts I found this very useful Excel macro created by Paul Dunn that will automatically create charts for all the data produced by vscsiStats. I thought was worth sharing since I always spend time creating those charts when I need to demonstrate the IO profile or troubleshoot storage latencies. Paul, thanks for that!
If you want to learn about vscsiStats for VDI read Improve VDI performance with IO Length Trending. For more info on how to use vscsistats please read this and this.
Download the Excel Macro from HERE.
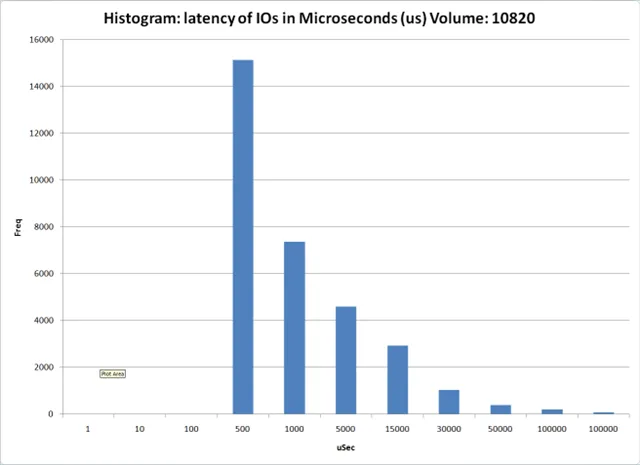
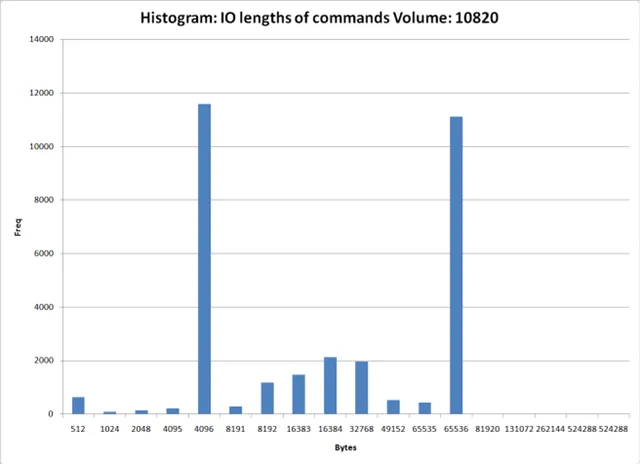
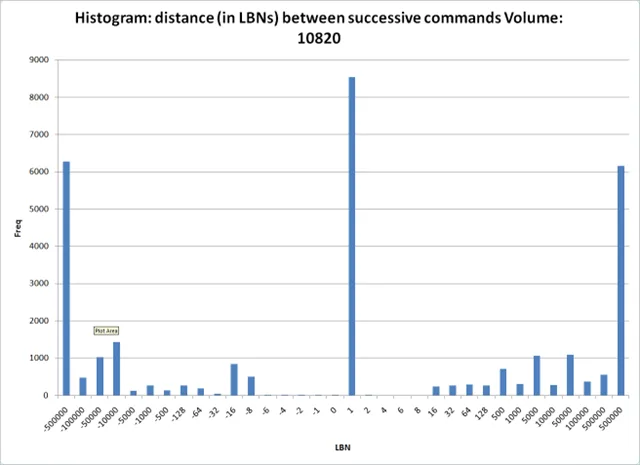
The original article from Paul Dunn can be found at New vscsiStats Excel Macro
5 comments
Erik Zandboer
Hi,
For an Excel chart drawing vscsiStats output I created one for 3D charts:
vscsiStats 3D surface graph part 3: Build your own! at http://www.vmdamentals.com/?p=1022
and some of its history and how to create the vscsistats output for it at http://www.vmdamentals.com/?p=722
Andre Leibovici
Erik, that's great work. Thanks for sharing!
chinnasamy
How can i use the 3D graph?...I ran vscsistats commands, but still confuse how to analyse those things in 3d graph?.
Default Threshold Latency size, Queuing size for VMs in VSCSISTATS?
Can u please Elaborate?...
Thanks,
chinnasamy
erikzandboer
Hi Chinnasamy,
Have you managed to export the vscsiStats output into the XLS sheet? If so, you should see the 3D graphs drawn in there. Is your question around "how to get the data into the XLS" or "how to interpret the generated 3D graphs"?
chinnasamy
Thanks erikzandboer, for your Reply. My Question: How to analyse for particular VM whether it has Read or Write intensive from over all 3D graph?..In 3D graph it shows over all performance b/w 20 mins interval for whole ESXi server.I got confused to get an idea in it.Is possible please share reference document. Thanks....
Comments are preserved from the original site and are closed.