Revisiting PostgreSQL Performance with Datrium v4.1 - Better Performance with Lower Latency
"Read this article to the end, to see the Aha Moment of Datrium performance."
I have broadly written about PostgreSQL performance with Datrium, and over time I also covered default installs, optimized configs and even running PostgreSQL bare-metal with the Datirum.
- PostgreSQL Benchmark on Datrium – 4.3 Million TPS with 1 GB RAM – and some Frustration!
- Software-Defined-Storage Architectures, a gift that keeps on giving! PostgreSQL and Datrium
- Is there an Optimization Limit for Applications and Databases? PostgreSQL and Datrium Demonstration
- PostgreSQL & Datrium – from Virtualization to Bare-Metal with Data Services
However, because Datrium is a software-defined architecture, it is always good to go back and re-evaluate performance gains after upgrades. I just completed some new tests with the imminent v4.1.1.0 release, and here are the results – Better performance with Lower latency.
On comparable hardware and running the exact same benchmark, during the space of three software releases, the overall performance increased by 25% and UPDATE latencies decreased by 28%.
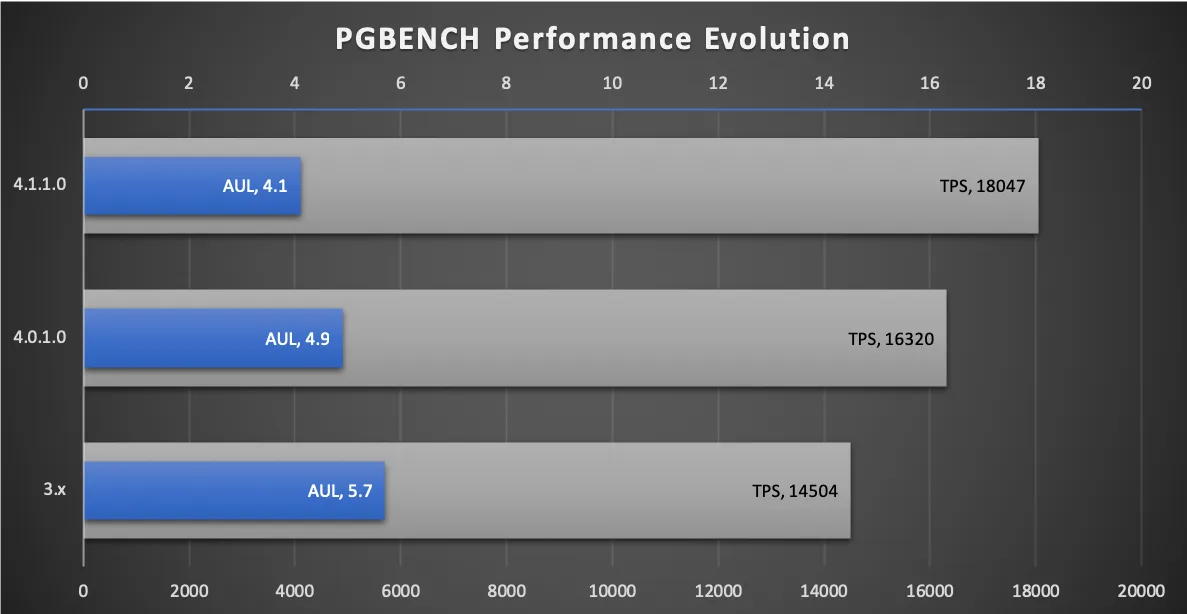
AUL (Average UPDATE Latency)
An important aspect to understand about Pgbench is that it will use as much VM CPU and RAM as possible to drive as many transactions per second as possible. As you can see in the picture below, Pgbench was driving a total of 45,877 IOPS (31K Read and 14.8K Write) at peak.
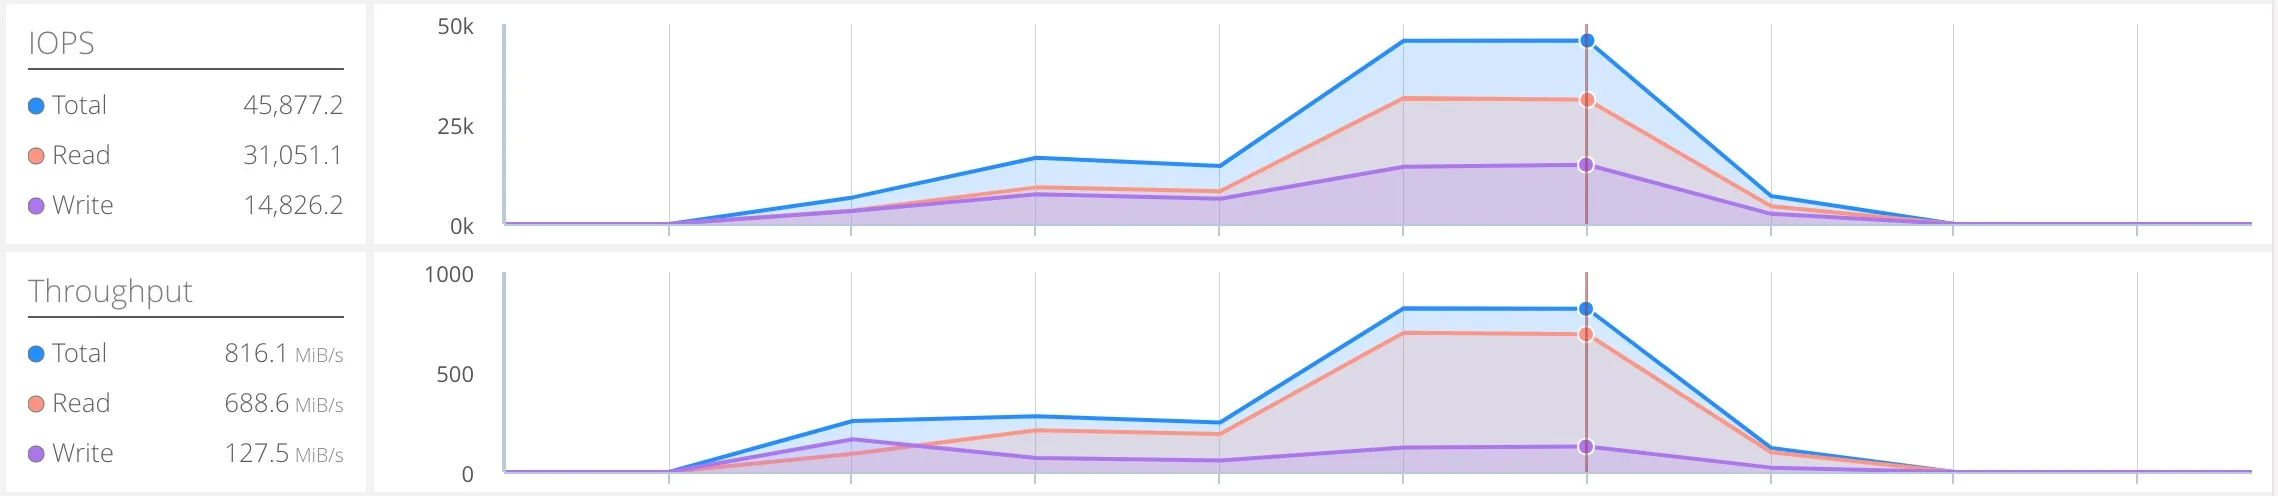
Assuming 32K or 64K IOs, Datrium peak throughput can hit 1.5Gbps write throughput with a single VM and single server. See this independent benchmark by IOMark.
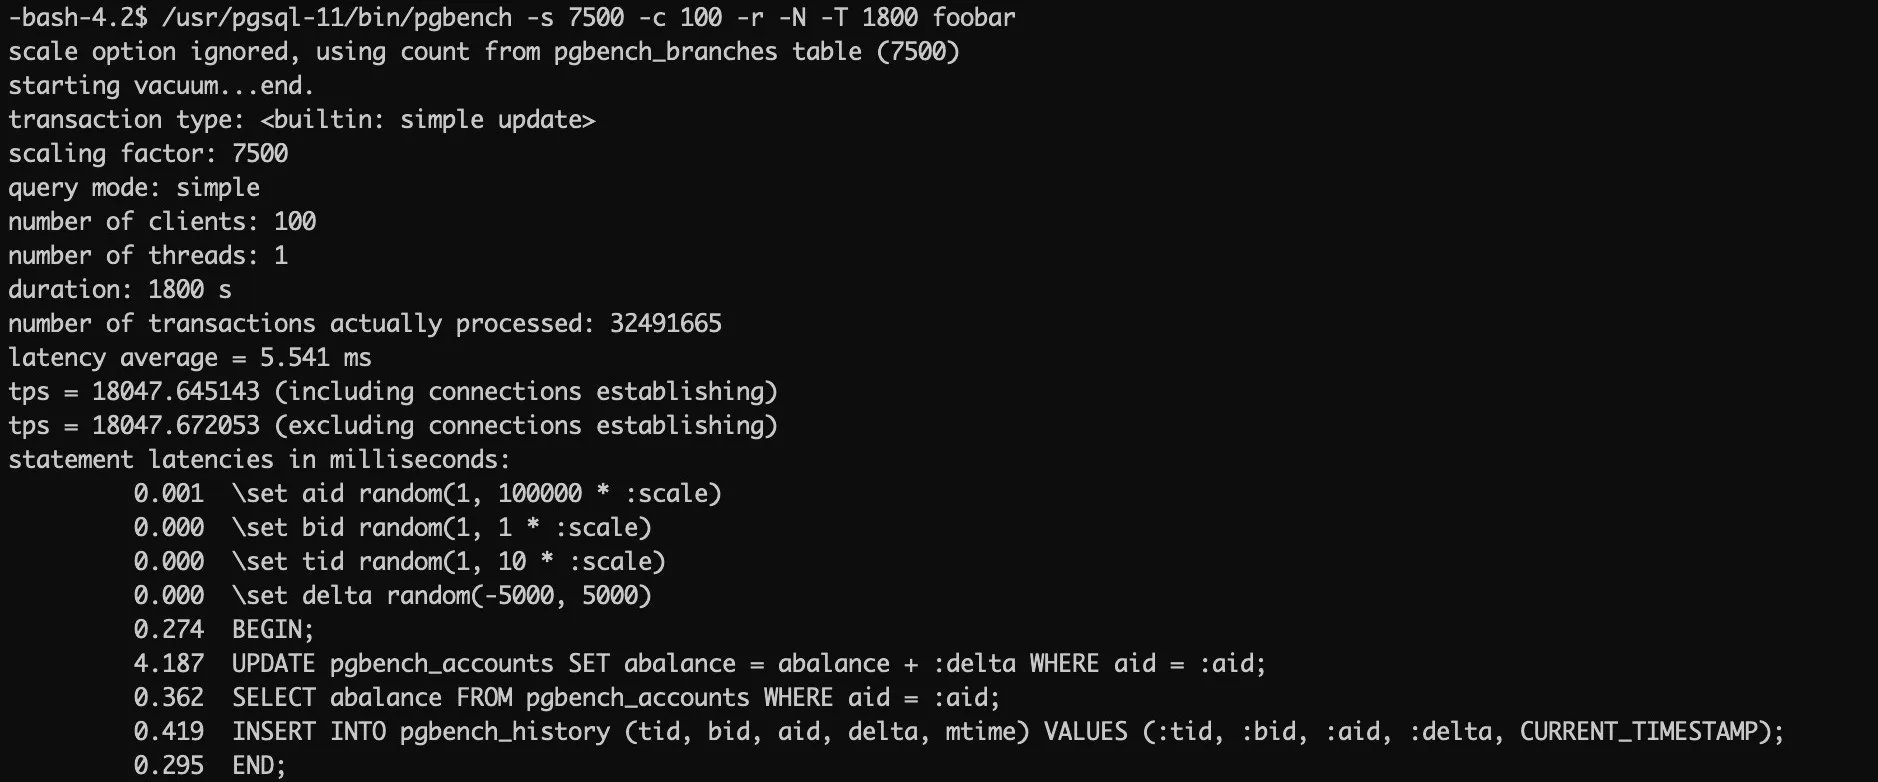
The latency displayed by Pgbench is what can be considered the worst possible latency when the CPU is being pushed to its limits. Generally, this won't happen in a production environment, leading latencies to be below 1ms.
Furthermore, Datrium runs applications with Erasure Coding (same as RF3 or FTT2) data protection for enterprise-grade data resiliency, and inline compression and deduplication services always turned On.
The reality is that storage vendors do not tell you this type of information, and they hide performance numbers when systems are under stress. So, next time you think about a new HCI platform for your PostgreSQL workloads, just follow the recipe below and you will be able to compare the numbers for yourself.
That said, performance benchmarks, especially synthetic ones, can be easily skewed by vendors, either switching hardware, changing resource configuration, modifying datasets and even changing the benchmark itself – so if I am going to make a comparison, it is essential to be open about what has changed between tests.
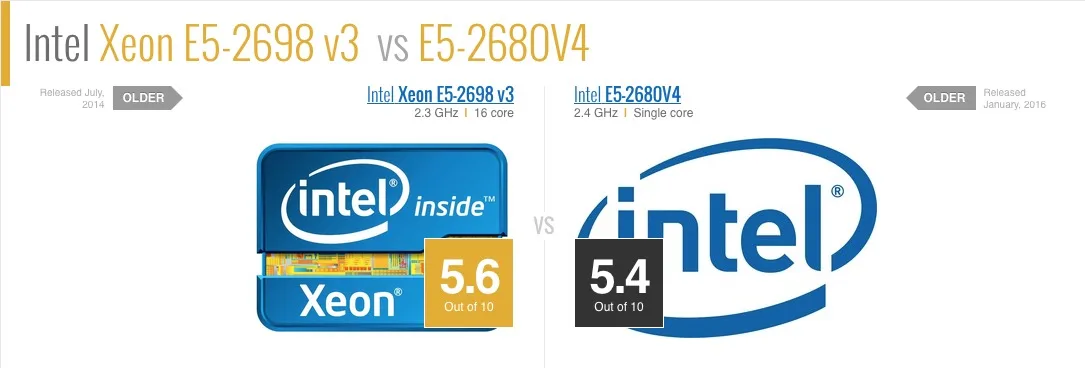
In my case, I am using a different CPU between tests, it went from an E5-2698 v3 @ 2.30GHz to an E5-2680 v4 @ 2.40GHz; and according to CPU BOSS website, the new CPU is slower than the previous one. Since Datrium is dependent on server CPU speed this has undoubtedly affected performance negatively.
- VMware ESXi hypervisor changed, from 6.0.0, 3620759 to 6.7.0, 8169922.
- VM configuration is overall the same, 16vCPU and 100GB RAM – and the PostgreSQL dataset is placed over three VMDK in an LVM logical volume, all backed by VMware Paravirtual SCSI controllers.
- PostgreSQL has was upgraded from v9.2 to v11 – the old one was too old – but interestingly enough I have experienced v11 having worse pgbench performance results than v9.2.
Running Pgbench
Here are the exact steps I used to configure the dataset and run the benchmark across all tests, in case you want to replicate. First, create a database instance using psql.
# CREATE DATABASE foobar OWNER postgres TABLESPACE foobar;
Run the pgbench database initialization. The following command loads a pgbench database using a scale factor of 7500, vacuums the resulting data, and then indexes it.
# pgbench -i -s 7500 –index-tablespace=foobar –tablespace=foobar foobar
Run the pgbench read/write workload for 30 minutes using the following command.
# pgbench -s 7500 -c 100 -r -N -T 1800 foobar
The Aha Moment
Would be great to deliver this kind of performance with new servers, improved software and a bunch of SSDs or NVMe, as I see storage and HCI vendors portraiting their technology. However, it is really something impressive to deliver that with only 2 SSDs on the server.
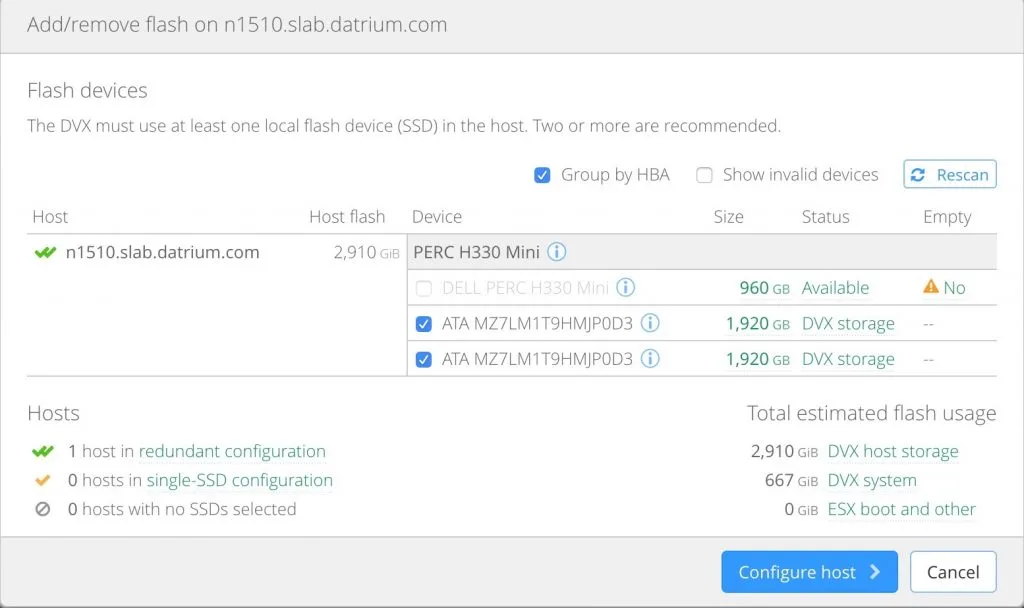
The Datrium split-provisioning architecture uses data locality to always read data from local-host flash, and for the write IOs, instead of distributing data across hosts (ala legacy HCI) it will dedupe, compress and erasure code to a JBOD unit, that will also serve as your fully-integrated backup.
With Datrium in a fully populated system with 128 servers and assuming 64Kb block size, you should expect to hit 1179 GB/s read throughput (yes, this number is correct!).
Conclusion
In this article, I demonstrate how software-defined architectures can have performance improvement across software releases while maintaining similar hardware.
In the Datrium case, all the intelligence resides on the hyperdriver, the software component that runs in each server and executes data services and data movement – and with every software upgrade, you get more out of the system.