I tried to win the office footy tipping with my own AI model
In Round 9 of this year's AFL season my model tipped all nine winners. Six rounds later I stopped submitting tips altogether. It took me until the end of the season to understand that both things had the same cause.
The competition was the usual office one, run across two football leagues. The NRL (National Rugby League) is Australia's professional rugby league competition, and it includes the New Zealand Warriors. The AFL (Australian Football League) is the top level of Australian rules football, which is a different sport altogether. Each week you pick the winner of every game and guess the margin of the first game as a tie-breaker.
I entered with no football knowledge at all. I could not tell you which teams are any good, and I do not even live in Australia. So I let the data do the picking: every tip came from a model, with no opinion of mine mixed in. It was not a chatbot or a large language model being asked who would win. I built my own prediction model for this one job, trained on nothing but match results and betting odds.
Starting with nothing but results
The starting point was data. I was able to download the result of every game since 2009. That is more than fifteen seasons and about 3,600 games per league, with scores, venues and dates.
A list of results is not something a model can learn from directly. Each game has to be described by numbers that were known before kick-off:
- A strength rating for each team, which moves up or down after every result. It is an Elo rating, the system used to rank chess players, adjusted for home advantage and the size of the win.
- Recent form: results over the last five and ten games, points scored and conceded, and whether scoring is trending up or down.
- The matchup: head-to-head record, each side's record at that ground, days since their last game, and whether either is coming off a bye. Nothing from the game being predicted, or from any later game, is allowed to leak in.
The first version, NRL only, picked 62.9% of winners in the 2025 season, which it had never seen. Venue records, scoring trends and bye weeks went in afterwards, each one checked against a test before it stayed. Then I made a second copy for AFL.
The Python behind it
Everything is written in Python. Fixtures and results are pulled from public feeds, the nrl.com draw and the Squiggle API for AFL, into a SQLite database. The pandas library turns that history into one row of numbers per game, fewer than thirty columns in all.
The learning is done by XGBoost, a library for gradient-boosted decision trees. Each model is 300 small trees, three levels deep, and every tree is trained to correct the errors of the ones before it. A classifier outputs the probability that the home team wins. A second model, a regressor, predicts the margin. It is a long-established method for tables of numbers, and it knows nothing about language. Training on 3,600 games takes less than a second on a laptop.
The weekly run is three commands:
python3.11 main.py scrape     # new results, fixtures and odds
python3.11 main.py train      # refit both models on everything so far
python3.11 main.py predict    # tips, confidence and margins for the round
Adding the bookmakers' odds
Results only tell the model what has already happened. They say nothing about an injured player, a late team change or the weather. Bookmaker odds do, because the price of each team reflects what the whole betting market knows. So odds were the next ingredient.
Past odds came from a free spreadsheet published by aussportsbetting.com, with closing prices back to 2009. Current odds come from The Odds API. Its free plan allows 500 requests a month, so every response is stored and nothing is fetched twice.
The odds are used twice. They are converted into an implied probability, which is one divided by the price, rescaled so the two teams add up to 100%. That number is given to the model as one more input. Then the model's output is averaged with that implied probability to give the confidence shown for each tip.
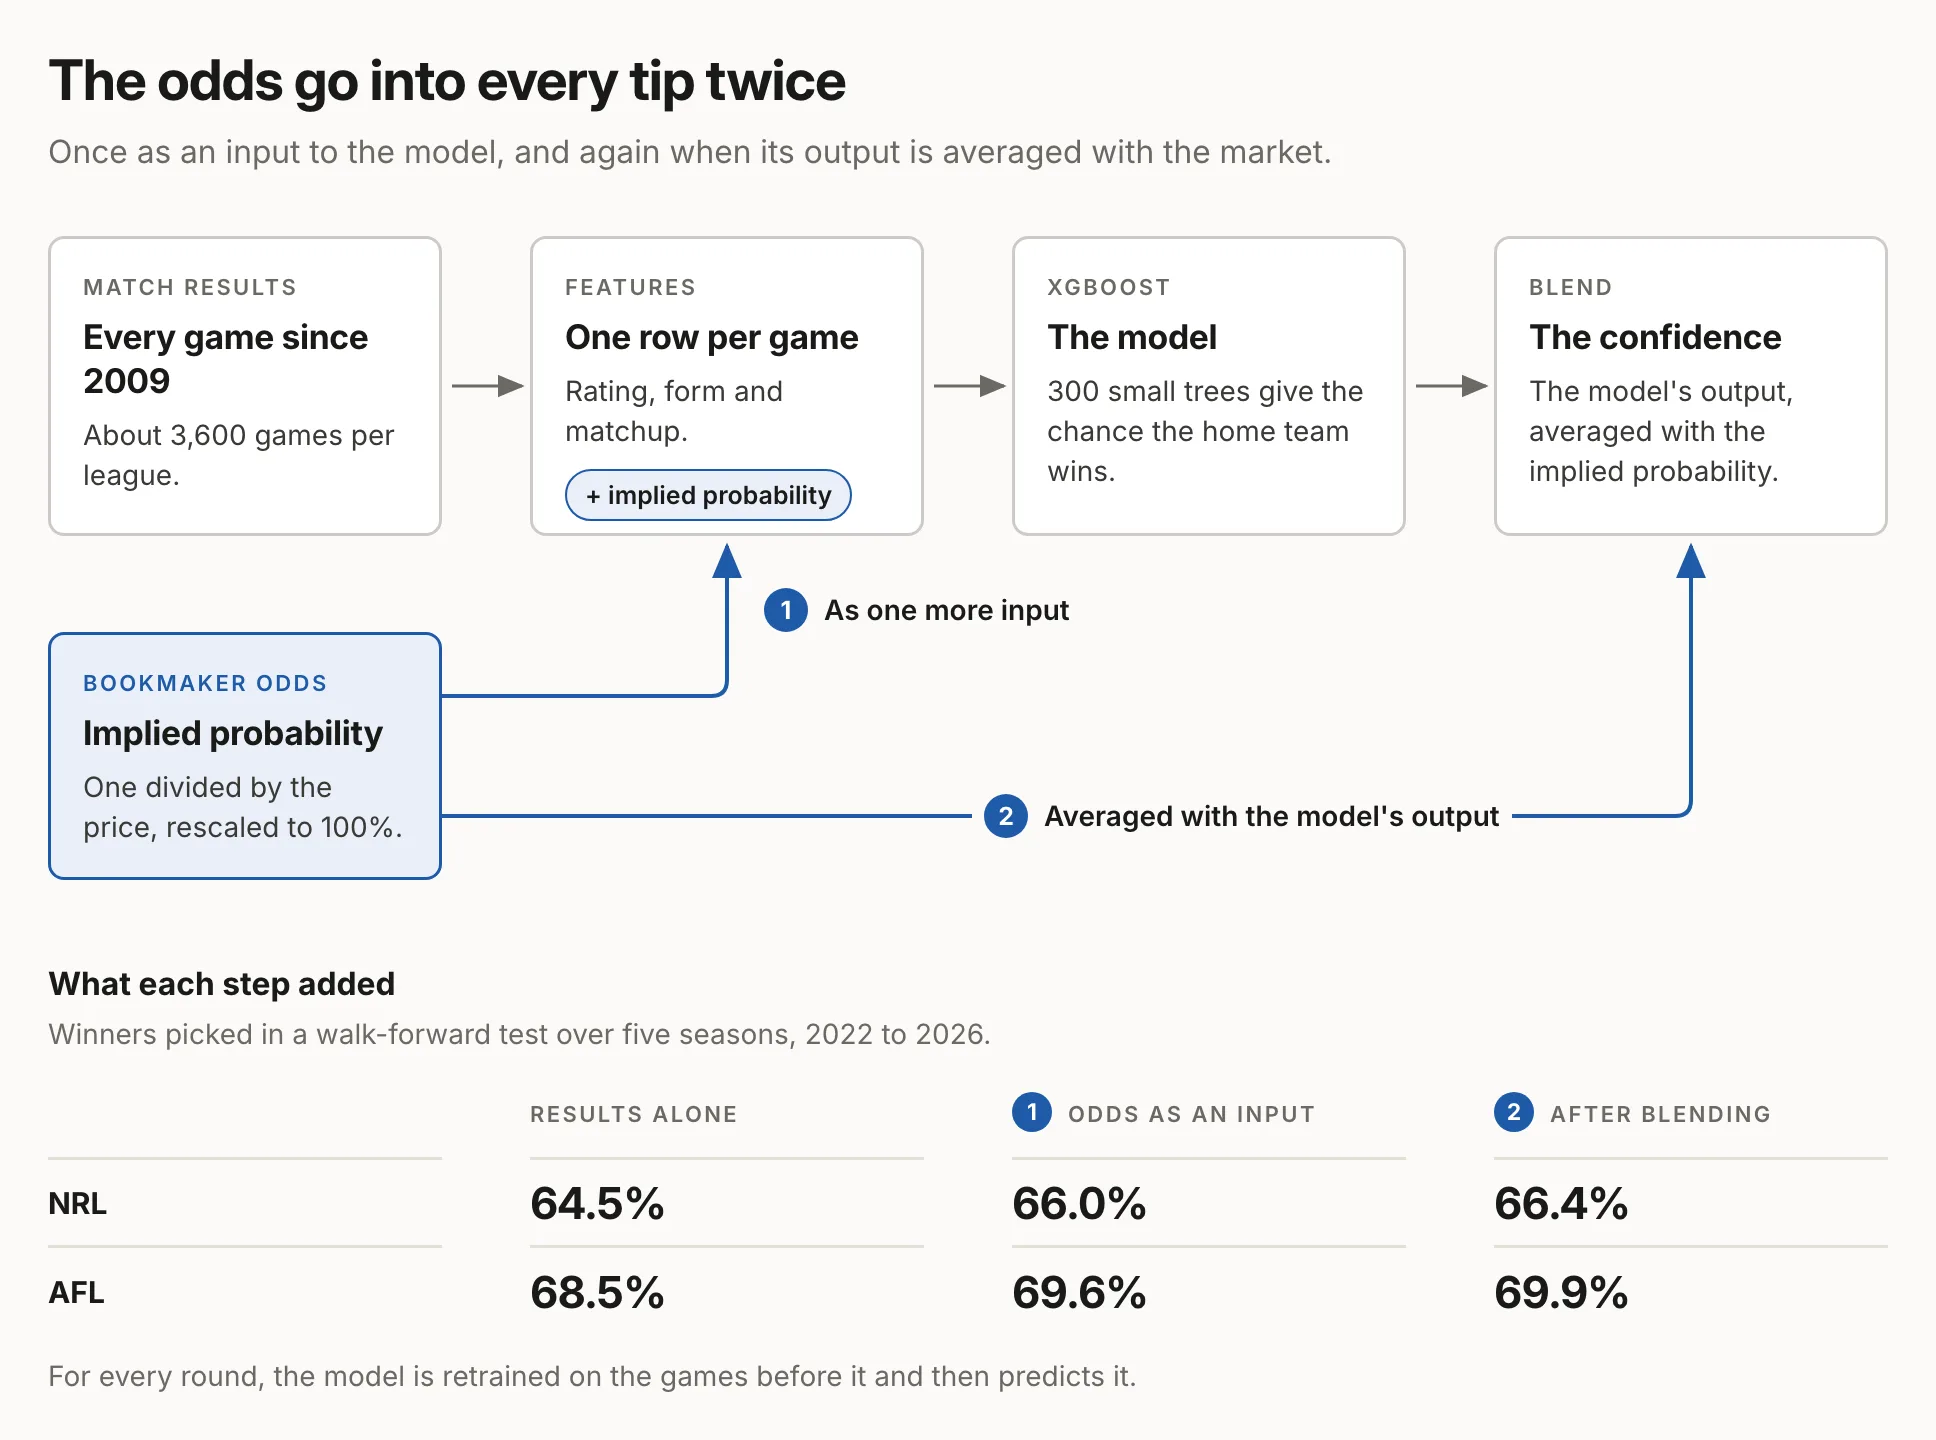
I measured each step with a walk-forward test. For every round across five seasons, 2022 to 2026, the model is retrained on the games before it and then predicts it.
- NRL: 64.5% of winners from results alone, 66.0% with odds as an input, 66.4% after blending.
- AFL: 68.5%, then 69.6%, then 69.9%.
One to two percentage points sounds small. Over a season of about 200 games it is three or four extra correct tips, which is several places on a tight ladder.
The 84% tip that was really 16%
Blending had a cost, and it showed up in Round 4 of the NRL season. The table had Storm over Cowboys at 84% confidence, so I used Storm as my pick in the knockout side competition. Cowboys won 28-24 and I was out of the knockout for the year.
When I went back through the numbers, the model on its own had given Storm a 16% chance. The 84% came almost entirely from the odds half of the blend. One tidy number had hidden a complete disagreement between my two sources.
After that, any game where the two disagreed was flagged and ruled out as a knockout pick. An averaged prediction is only useful when you can also see the numbers that went into it.
What a perfect round was made of
Round 9 of the AFL season was my nine from nine. When I went back through every tip I had submitted, those nine tips were the nine bookmaker favourites. All nine favourites won that week. The model had not seen anything the market had missed.
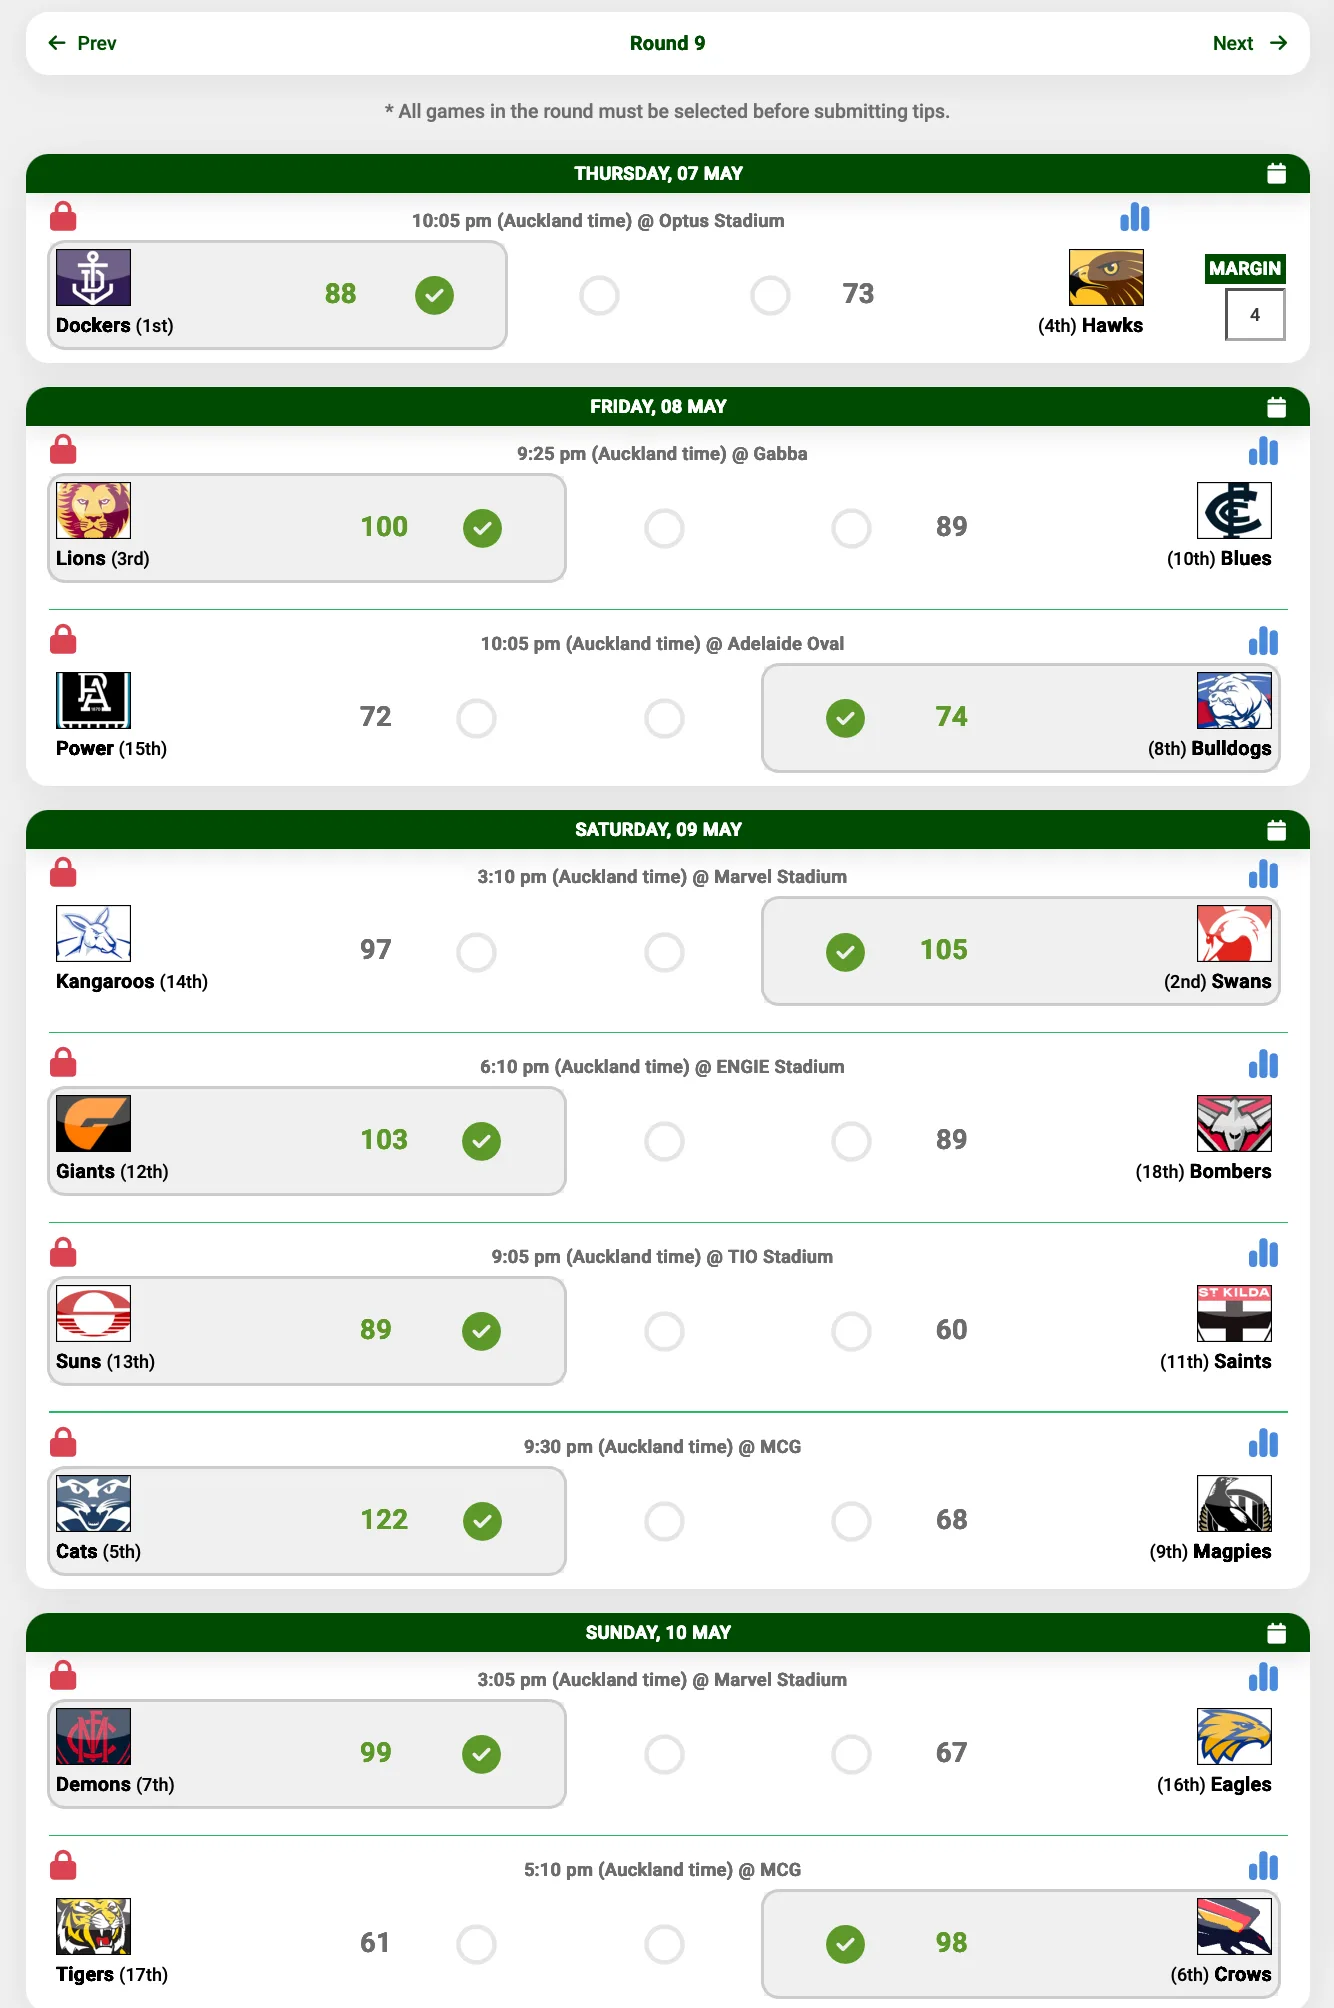
Over the rounds I tipped, the pattern held in both leagues:
- AFL: 85 correct from 127 games, or 67%. Tipping the favourite every time would have scored 94.
- NRL: 75 correct from 120. The favourite scored 76.
- My AFL tips went against the favourite 25 times. They were right 8 times.
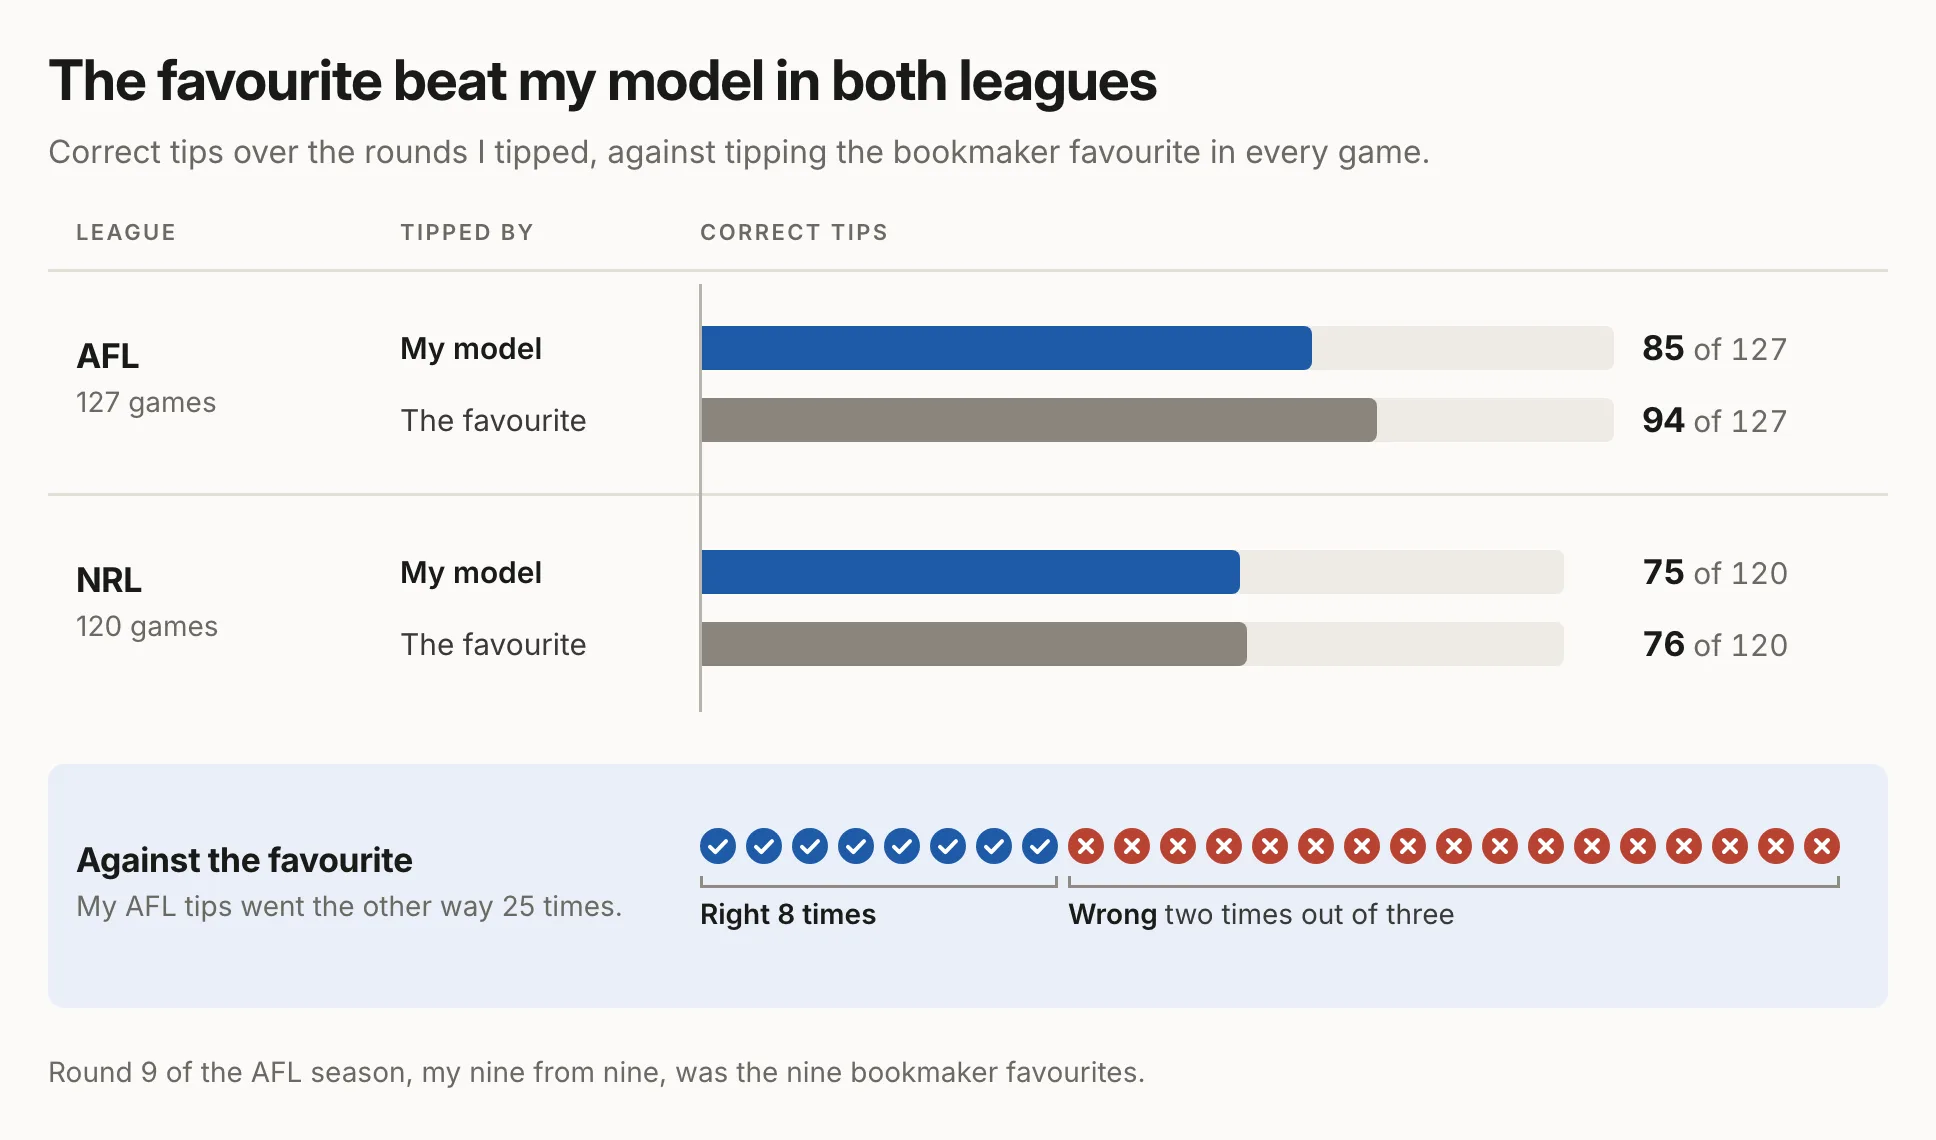
This is the other side of adding the odds. Blending pulls every tip towards the favourite, and in AFL the tips that still went the other way were wrong two times out of three. Rounds 10 to 12 produced ten correct tips from 25 games. I stopped after Round 15 in AFL and Round 16 in NRL.
Why a good hit rate still loses money
The obvious next question was what would have happened with a fixed stake on every tip. Across the same five seasons the blended model picked about 70% of AFL winners and 66% of NRL winners. Both figures are within a percentage point of simply backing the favourite. Staking the same amount on every tip, more than 1,000 bets per league, lost about 3% of the money staked in AFL and about 5% in NRL.
The reason is the price. Take Port Adelaide against the Western Bulldogs in Round 9, which closed at 2.00 and 1.80. Those odds imply a 50% chance and a 55.6% chance, which add up to 105.6%. The extra 5.6 points is the bookmaker's margin, and it is built into every game.
Tipping rewards being right. Betting only rewards being more right than the price already assumes. Even a model that picked 80% of winners would lose money if those winners were paying 1.20, because at that price you need better than 83% just to break even.
The model will run again next season, for tipping only. The test I have set it is modest: beat a colleague who does nothing but pick the favourite. If it cannot, I have automated something a glance at the odds does already.