How we halved search latency without changing a single ranking
Our internal knowledge search took 22 seconds at the median and 52 seconds at the 95th percentile. The AI agents calling it over MCP (Model Context Protocol) repeated queries in bursts, which looks a lot like retries after timeouts and only added load. I spent a day on it. A typical search now takes about 9 seconds, a repeated query comes back in 0.14 seconds, and on every real query I replayed the top ten results came back in the same order as before.
All of the work was in the reranking stage of a hybrid search pipeline. If you run a cross-encoder on CPU, most of it applies to you.
Where the 22 seconds went
The pipeline is fairly standard. A query fans out to four retrievers in Postgres: full-text, pgvector similarity, a rare-token pass and a recency-weighted pass. Reciprocal rank fusion merges the lists, then a cross-encoder (BAAI's bge-reranker-v2-m3) rescores the top 20 candidates and we keep 10.
Every search already logs per-stage timings, so I did not have to guess. Over seven days and 186 searches, the medians were:
- query embedding: 91 ms
- all four retrievers, run in parallel: 396 ms
- reranking: 21.9 seconds
- context expansion: 8 ms
Reranking was 98% of the latency, and the p95 said the same thing at 51.7 seconds.
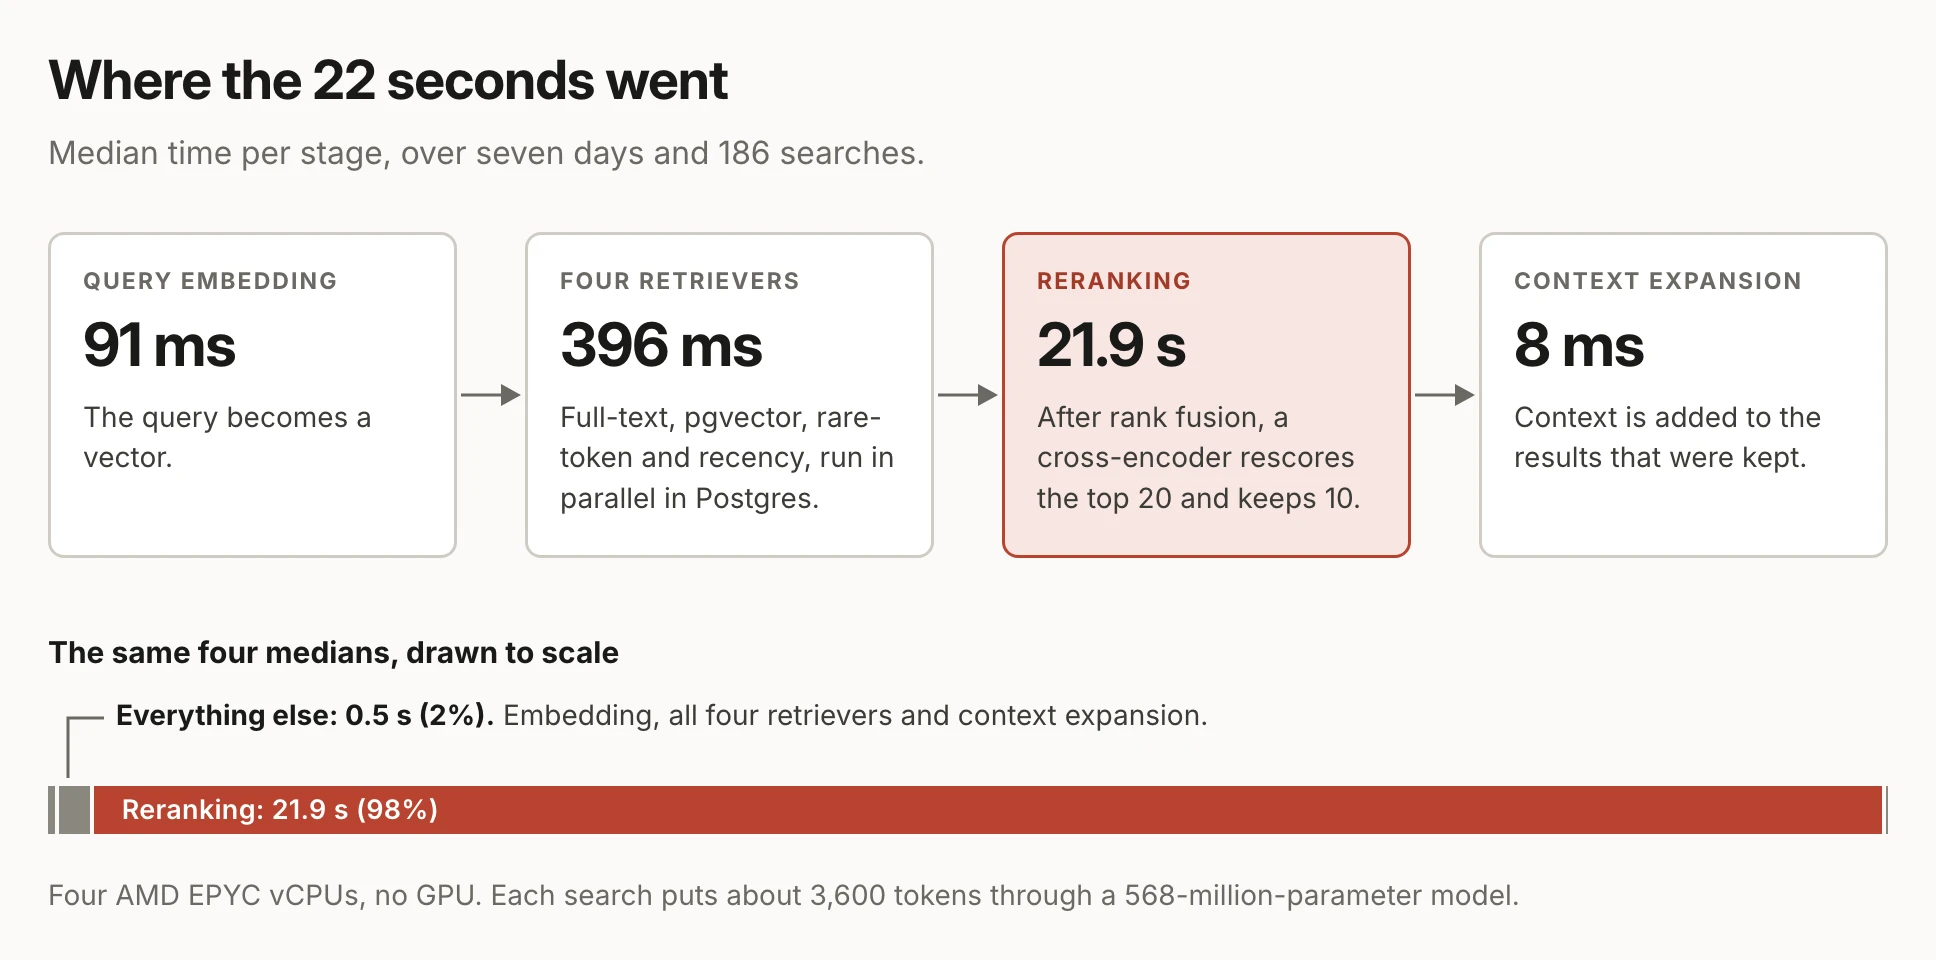
The service runs on a VM with four AMD EPYC vCPUs, AVX2 but no AVX-512, and no GPU. It shares those cores with Postgres and another application. bge-reranker-v2-m3 is a 568-million-parameter XLM-RoBERTa model, and twenty pairs averaging 178 tokens is about 3,600 tokens through it per search. This CPU managed fewer than 200 tokens a second.
Our own documentation quoted 2.8 seconds for the same settings. The document does not say what hardware that was measured on, and production took more than seven times as long.
Decide what "no accuracy loss" means first
The tempting fixes all trade accuracy: a smaller reranker, fewer candidates, shorter snippets, int8. So I defined "no loss" before changing anything.
The harness pulls recent distinct queries from the audit log, runs retrieval up to the point where the reranker takes over, and saves each candidate slate with the exact text the reranker sees. Every variant then scores the same 12 slates of 20 pairs, on the production host, and is compared with the current fp32 model on three measures:
- whether the top result stays the same
- how much of the top ten overlaps
- whether the reference top five all stay inside the top ten
There is no labelled ground truth here. The reference is what users get today, which is the right bar when the brief is "faster, same results".
Production enforces per-user access to sources, and retrieval with no user resolves to an empty scope. A harness that runs without a user gets zero candidates and reports very fast times. I replayed each query as the user who originally ran it, and asserted the slate size before timing anything.
What the numbers said
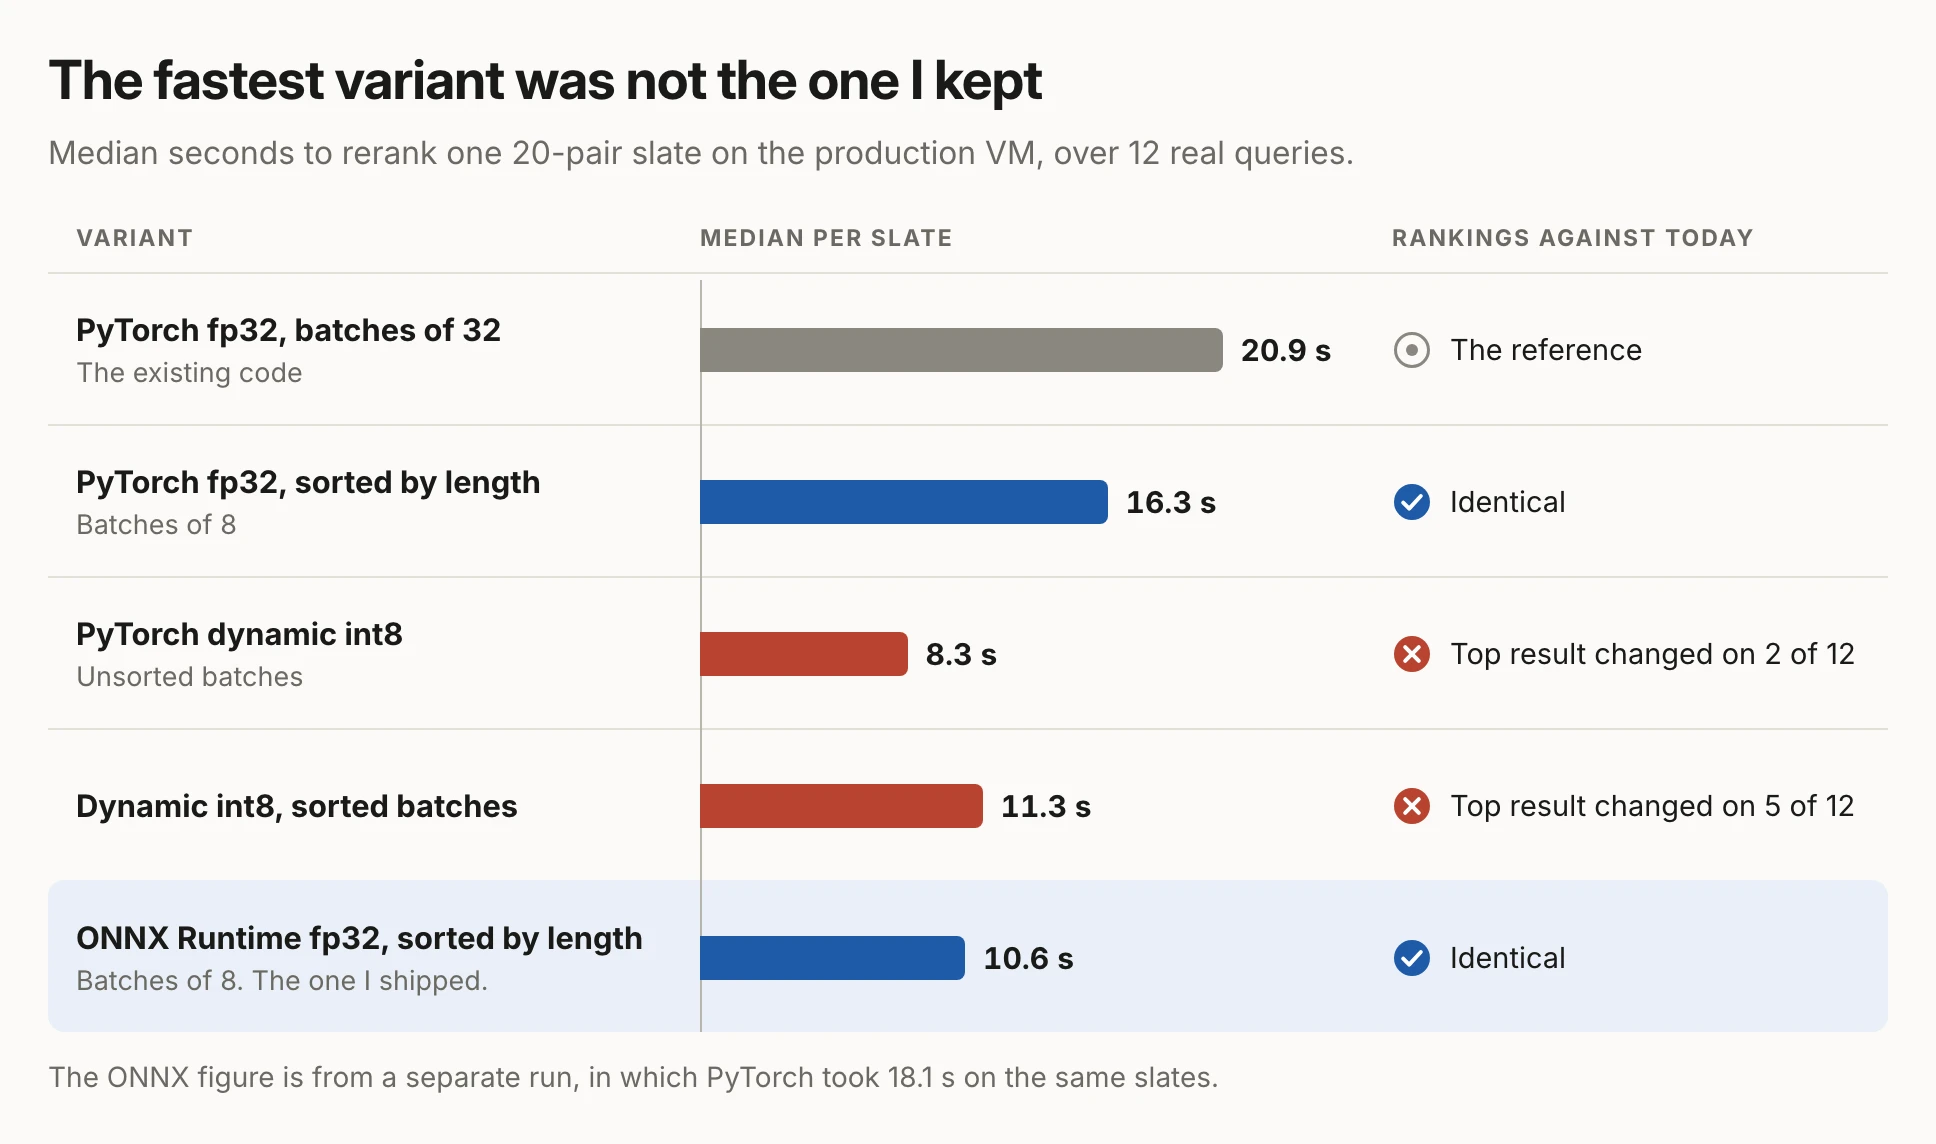
Median seconds per 20-pair slate, on the production VM:
- PyTorch fp32, batches of 32 (the existing code): 20.9 s
- PyTorch fp32, pairs sorted by length, batches of 8: 16.3 s, identical rankings
- PyTorch dynamic int8: 8.3 s, top result changed on 2 of 12 queries
- dynamic int8 with sorted batches: 11.3 s, top result changed on 5 of 12
- ONNX Runtime fp32, sorted batches of 8: 10.6 s against 18.1 s for PyTorch in the same run, identical rankings
Sorting was the cheapest win. A batch is padded to its longest member. Our pairs averaged 178 tokens but ran up to 326, so one long snippet made every pair in the batch pay for 326 tokens. Sorted batches of 8 only pad short pairs to other short pairs. The arithmetic on real tokens is unchanged, so the scores are too.
Int8 was the fastest option I tried, and I threw it away. Dynamic quantisation works out activation scales from each batch at run time, so a document's score depends on which documents share its batch. Sorting changed nothing for fp32, but it dropped int8's top-1 agreement from 10 of 12 to 7 of 12. That rules it out for ranking.
Why did ONNX Runtime win on the same weights?
ONNX Runtime ran the identical fp32 weights 1.7 times faster than PyTorch eager on this CPU. I did not profile why. The usual explanation is that its default graph optimisations fuse common transformer patterns into fewer, larger kernels, which pays off when you only have four cores. The heavier transformer optimiser saved about another 8%, but it did not fuse attention for this model, so I left it out.
The export had a few steps that are easy to get wrong.
- The export runs once, in a subprocess, into the Hugging Face cache. At 2.27 GB the weights exceed protobuf's 2 GB limit, so the graph is saved with external data.
- I exported with
torch.onnx.export(the dynamo exporter) using dynamic batch and sequence axes. A dynamic export traced from a two-row example can quietly specialise, so I tested batch size 1 and a 2,091-token input explicitly. Scores matched PyTorch to within 3 × 10⁻⁶. - sentence-transformers applies a sigmoid to single-label cross-encoders. ONNX returns the raw logit, so the runtime applies the sigmoid itself, or every score clients see changes scale.
- I turned off
session.intra_op.allow_spinningto leave more CPU for Postgres. It cost 40%, from 9.6 s to 13.7 s, so it went back on. In practice the threads only spin while a forward pass is running.
Locks, caches and the event loop
Three further changes mainly reduce the p95.
The first is concurrency. Each forward pass already uses every core, so two at once just thrash: overlapping requests took 53 to 83 seconds. A process-wide lock now runs one forward pass at a time. Three simultaneous searches finish at 12, 19 and 26 seconds instead of all finishing late.
The second is a score cache. Over a week, 220 searches held only 178 distinct queries, and one ran 13 times in 16 minutes. Scores are now cached by model, query and exact snippet text, so an edited document misses the cache instead of serving a stale score. The lookup has to happen inside the lock. If it happens before, a retry that arrives while the original is still scoring finds nothing cached, waits for the lock, and then scores all the pairs again.
def score(pairs):  # simplified; runs in a worker thread
    with predict_lock:
        keys = [(model_name, q, d) for q, d in pairs]
        misses = sorted((i for i, k in enumerate(keys) if k not in cache),
                        key=lambda i: len(pairs[i][0]) + len(pairs[i][1]))
        for chunk in itertools.batched(misses, 8):
            scores = model.predict([pairs[i] for i in chunk])
            for i, s in zip(chunk, scores):
                cache[keys[i]] = float(s)
        return [cache[k] for k in keys]
The third fix was for an older problem. The model loaded on the asyncio event loop the first time it was used. That cost a few seconds once. With a 30-second export in front of it, it would have frozen every request, so the load now happens in the worker thread too.
What it looks like in production
A fresh test search through the live endpoint took 9.3 seconds end to end, and the same query repeated took 0.14. The ONNX path falls back to PyTorch if the export or the runtime fails. Every audit row records which runtime served it, so a fallback to the slower path can be found with a database query. An automated code review caught one bug I had missed: with a custom export directory, changing the model reused the old graph, because the completion marker recorded the model name and nothing compared it.
Nine seconds is still slow. A search asking for 20 results reranks 40 pairs, which takes roughly twice as long. I have not found more on four cores that keeps the rankings intact, so the next step is the same model on a GPU, where 20 pairs should take well under a second. I have not measured that yet.