GPUDirect Storage pulls ahead of the host path with enough requests in flight and a current cuFile
Last week I wrote that GPUDirect Storage added no bandwidth on an NFS-over-RDMA mount. That result held for one configuration: 8 threads, 16 MiB requests, cuFile 1.15.1.6 and one-second runs. This post widens the test. Whether GDS helps depends on two things the storage path does not decide: how the application issues its I/O, and which cuFile library it ships.
An application that keeps many requests in flight gets GDS at or above the host path on the same mount. One that reads with a few threads does not, unless its cuFile is recent enough to split large requests for it. Most applications inherit that library from their framework, and the one in the image I tested was five minor releases behind.
I got there because NVIDIA’s GDS team read the post, asked for a call within days, and came with a hypothesis and a list of tests. This post covers what they suggested, what I measured, and how it changes the picture.
What the NVIDIA team did
I sent the GDS team my measurement notes with eight open questions. Several engineers joined the call. They had read the numbers closely enough to pick out the oddest one: cuFile’s compatibility mode matched GDS instead of matching the host path.
They came with a specific hypothesis and a short plan:
- A likely cause. A
parallel_ioissue in the cuFile library shipped with CUDA 13.3, since fixed in 13.3 Update 1, can serialise large requests on high-latency filesystems. It would affect GDS and compatibility mode equally, which fitted my data. - Two quick tests. Set
execution.parallel_ioto false incufile.json, or drop the request size to 8 MiB or less. - A baseline with their tool. Run
gdsiofirst, before adding a Python stack on top. - A better harness. Replace my ctypes binding with KvikIO, which fans out I/O in C++ threads.
- A configuration check. Run gds-diag, their new diagnostic tool, against the mount.
They also said plainly that GDS shows its gains at scale, with many GPUs and NICs working in parallel. The rerun showed the same thing.
How I retested
I changed one thing at a time against a reproduced baseline: 249 runs on one RTX PRO 6000 Blackwell GPU, on the same NFS-over-RDMA mount as before. Every run verified its data byte for byte, and the nvidia-fs counters moved only in the GDS runs.
The three paths are the same as in the first post: GDS, cuFile in compatibility mode, and the host path (O_DIRECT into pinned memory, then a copy to the GPU).
I varied threads from 1 to 64, request size from 1 to 16 MiB, run length (one 4 GiB pass, or 10 to 20 seconds), the pod’s CPU limit and the cufile.json settings. I also varied the cuFile library, across 1.15.1.6 (the version in the container image), 1.18.0.66, 1.18.1.6 and 1.20.0.107, and the harness, across my ctypes binding, KvikIO and NVIDIA’s gdsio.
Runs within a stage were interleaved in random order, so drift on the storage side could not land on one configuration. I did not rerun the eight-GPU H200 server, because its GPUs were in use.
What moved the numbers
Three things did: thread count, the cuFile library version, and run length.
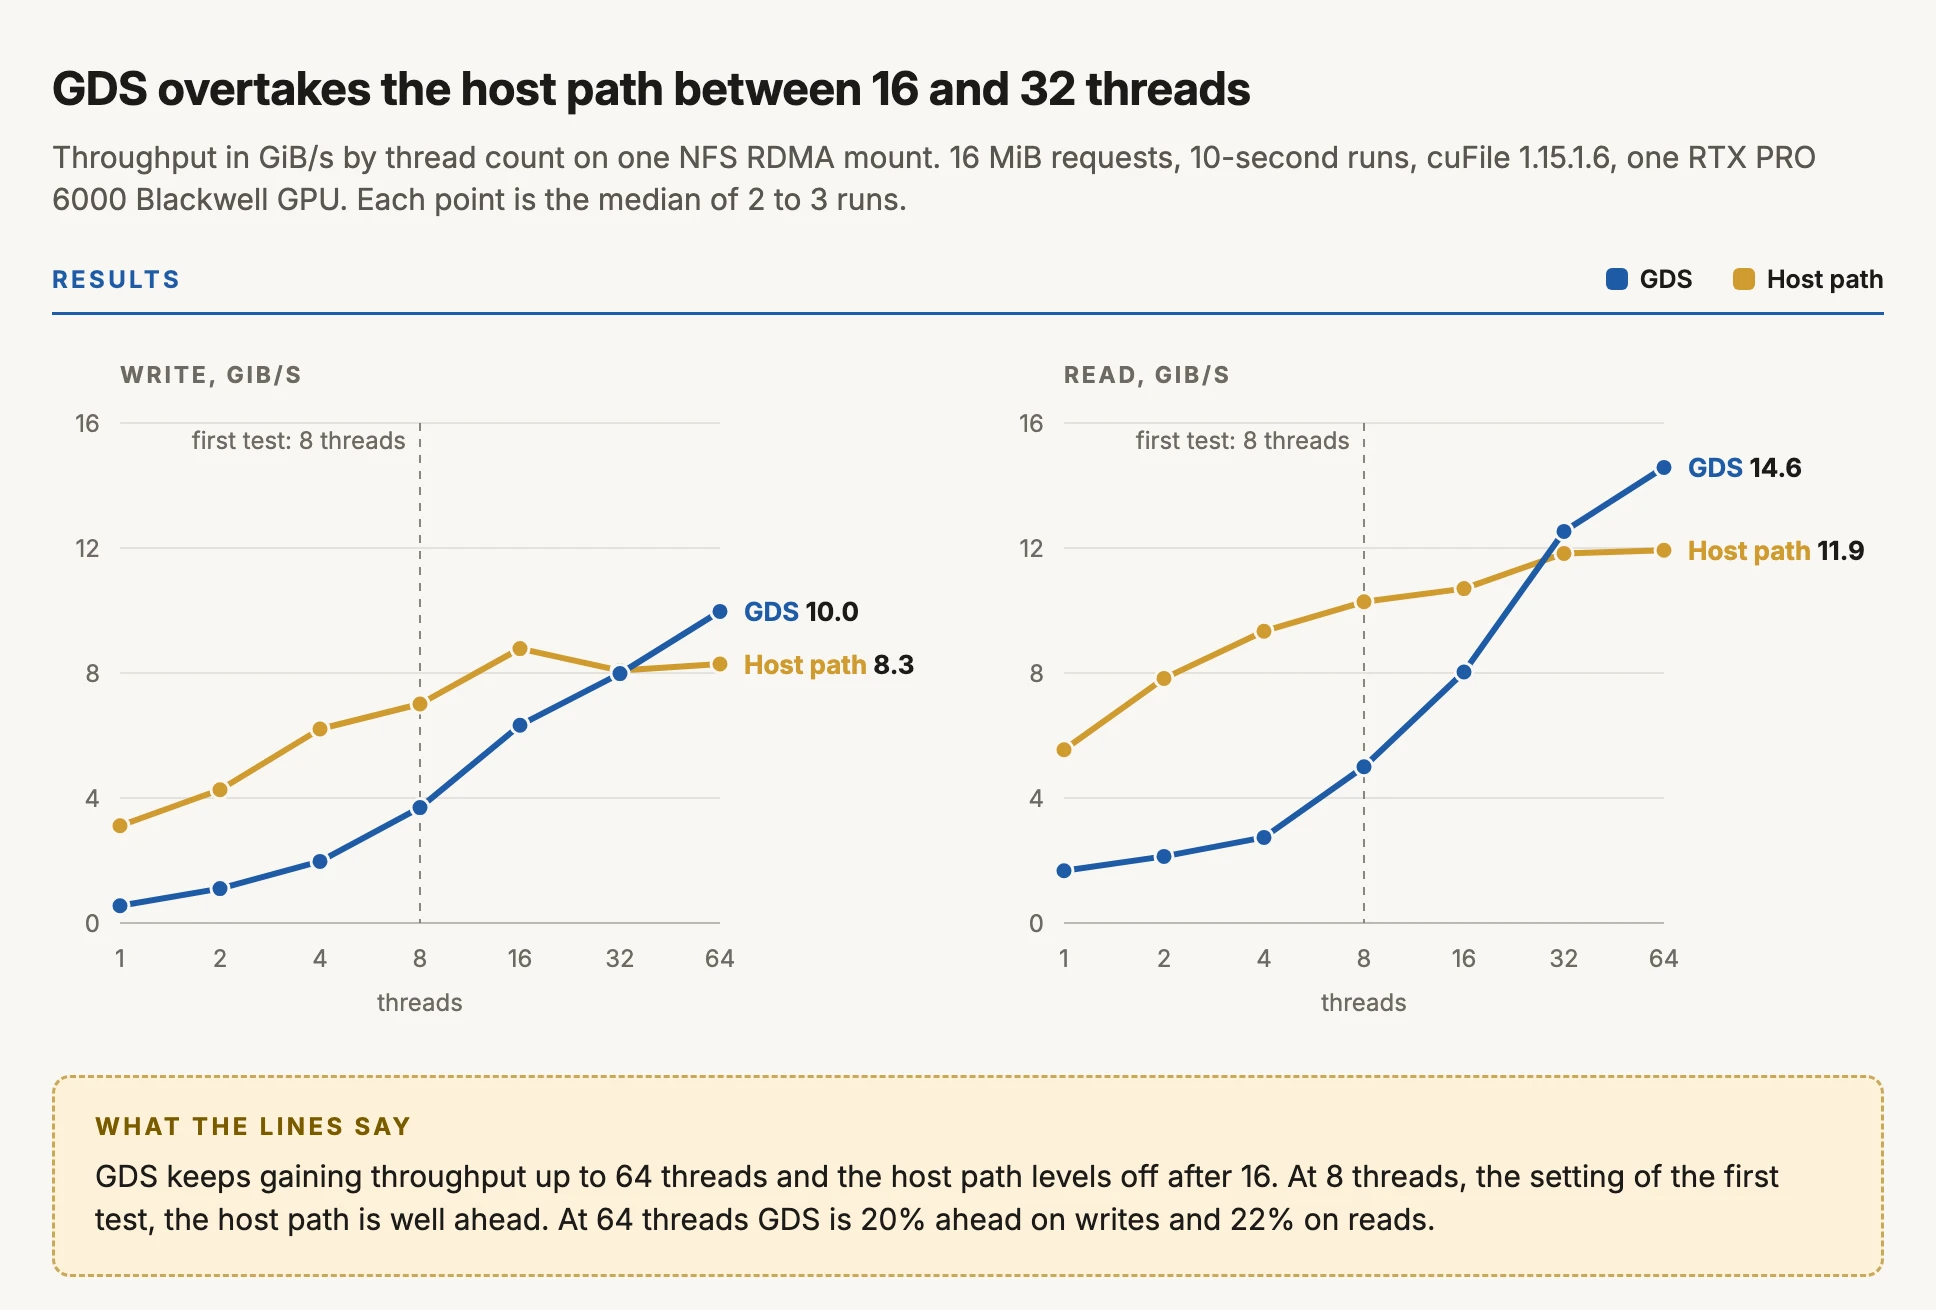
Thread count. GDS keeps gaining throughput up to 64 threads, and the host path levels off after 16. They cross between 16 and 32 threads. At 64 threads GDS is 20% ahead on writes and 22% on reads.
The cuFile library version. A newer library is faster with the test shape held constant. From 1.18.1 onward, cuFile splits a large request into pieces and runs them in parallel. The 1.15.1.6 library in the image I tested does not.
| Test | cuFile 1.15.1.6 | cuFile 1.20.0.107 |
|---|---|---|
| GDS, my harness | 3.8 / 5.0 | 5.9 / 8.4 |
GDS, NVIDIA’s gdsio | 4.1 / 6.5 | 9.9 / 15.5 |
| Compatibility mode, my harness | 3.6 / 4.5 | 8.7 / 12.8 |
Host path, gdsio (no cuFile I/O) | 12.5 / 13.4 | 12.6 / 13.2 |
The version-by-version chart is in the section on the parallel_io issue below.
- In my harness the library alone is worth 56% on writes and 68% on reads at 8 threads.
- With
gdsiothe gain is about 2.4 times, and GDS reads pass the host path at 8 threads. - At 32 threads there is no real gain, because the mount is already near its ceiling.
- At 1 MiB requests there is no gain either (3.6 / 4.7 GiB/s), because there is nothing to split.
- Turning
parallel_iooff on 1.20.0.107 drops the 8-thread read from 8.4 to 7.1 GiB/s. The split explains part of the gain; I did not isolate the rest. - On 1.20.0.107, compatibility mode in my harness is faster than GDS at 8 threads. I have not found the cause.
gdsioon the same library has GDS at 9.9 / 15.5 GiB/s, so it may be my harness.
One caveat: I loaded the newer libraries into the CUDA 13.0 image by path. I have asked NVIDIA whether that combination is supported.
Run length. My first test wrote and read 4 GiB once, which takes about a second. On 10-second runs the host-path write rate rose from 3.9 to 7.0 GiB/s and the GDS write rate from 2.6 to 3.7 GiB/s. Longer runs gave higher rates on every path, and most on writes.
What did not move them
On the library version the image ships (1.15.1.6), none of these changed the result beyond run-to-run noise:
- The pod’s CPU limit. Removing the 4-CPU limit made no difference at 8 threads. I did not test it at 64 threads, where the paths use far more CPU.
parallel_ioset to false. No change at 8 or at 32 threads.- Request size. cuFile gave the same rate at 1, 4, 8 and 16 MiB. The host path was the one that changed: at 1 MiB it fell to the cuFile rate.
- Other
cufile.jsonsettings.max_io_threads,max_request_parallelismandmax_direct_io_size_kbdid nothing, so the defaults are fine. Poll mode was 12 to 17% slower. - The harness. My ctypes binding, KvikIO and
gdsioagreed on the same library. KvikIO read at 4.8 GiB/s at 8 threads against 5.0 for ctypes, and 14.8 against 14.6 at 64. Python and the GIL were not the limit.
Why the first test showed GDS behind
My first test compared 8 requests in flight against far more than 8. The mount negotiates a 1 MiB read and write size. With cuFile 1.15.1.6, each thread keeps one request in flight, whatever its size. The kernel’s NFS client treats a 16 MiB O_DIRECT request differently: it fans it out into up to 16 concurrent 1 MiB RPCs.
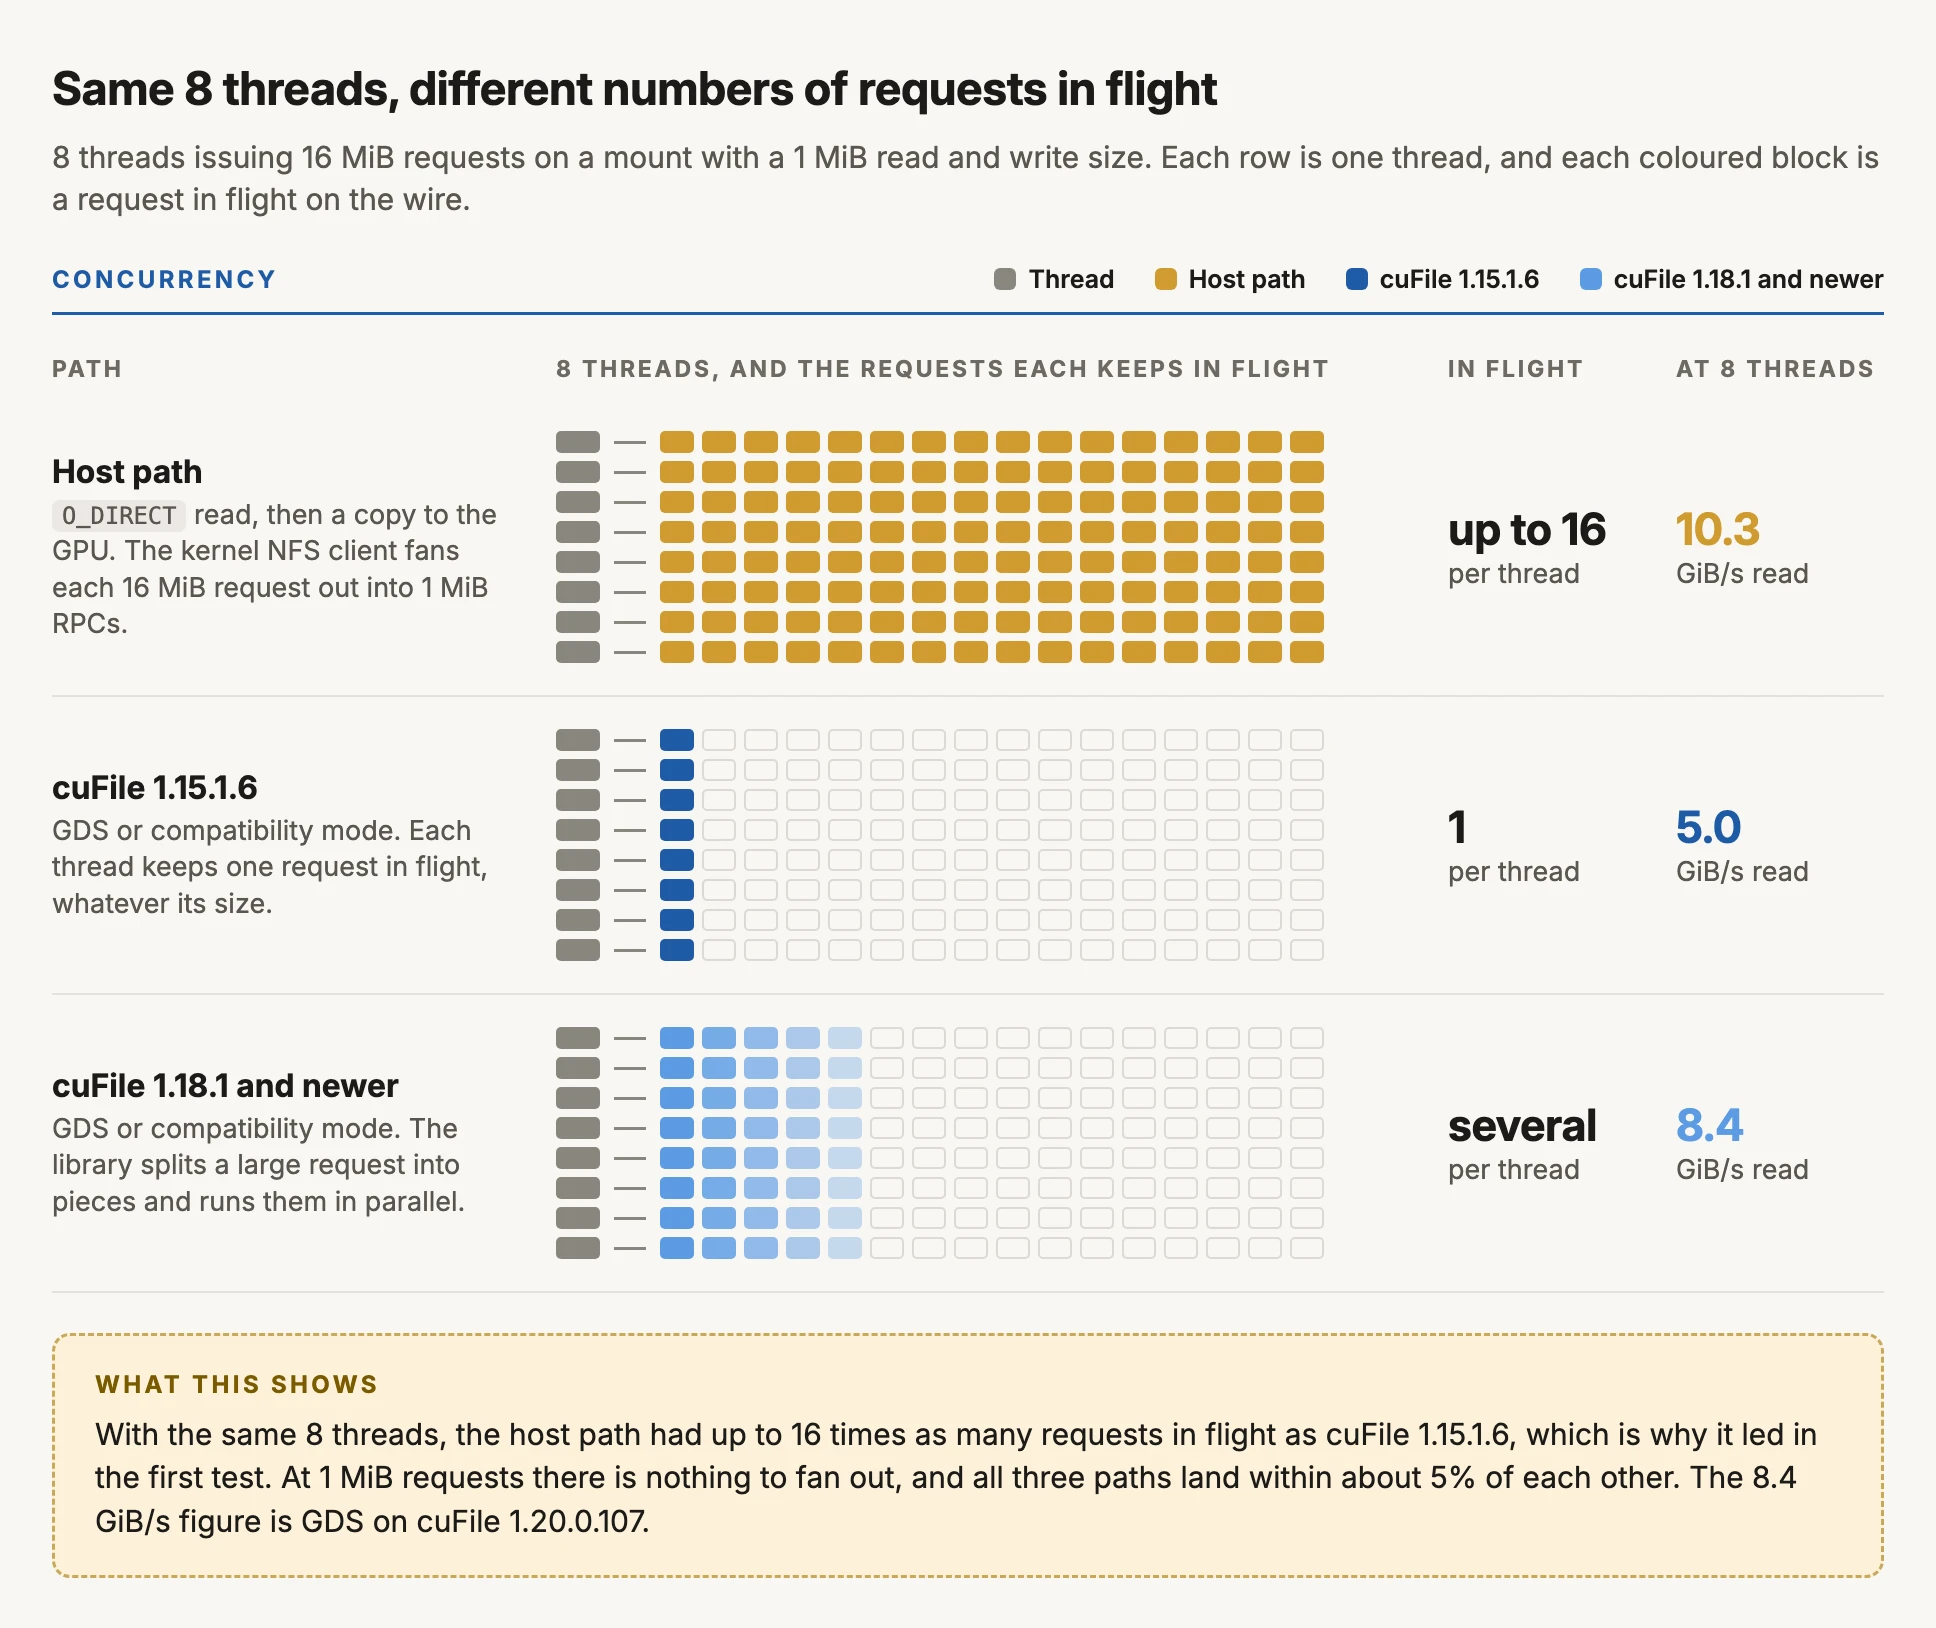
So with 8 threads and 16 MiB requests, the host path had many times the concurrency of the cuFile paths. Three observations fit this reading:
- One host-path thread reads at 5.5 GiB/s. One cuFile thread reads at 1.7 GiB/s.
- At 1 MiB requests there is nothing for the kernel to fan out, and at 8 threads all three paths land within about 5% of each other.
- Compatibility mode matched GDS because both go through the same cuFile request handling. The transfer into GPU memory was never the slow part.
At high thread counts every path converges at 14 to 16 GiB/s. That is the ceiling of one storage address, about a third of the 400 Gb link. I checked by mounting the same directory through all four addresses of the storage pool and reading from them at once: about 14.5 GiB/s on one address, about 30 on two, and up to 40 on four, for GDS and the host path alike. The network card’s own counters showed 354 Gbit/s, 88% of line rate. Writes stopped at about 17 GiB/s, a separate limit I have not looked into.
The parallel_io issue NVIDIA flagged: confirmed, and already fixed
The parallel_io issue the team described reproduces exactly as they said, in cuFile 1.18.0.66, the library shipped with CUDA 13.3. NVIDIA fixed it in 13.3 Update 1. The image I tested ships 1.15.1.6, from CUDA 13.0, which predates it.
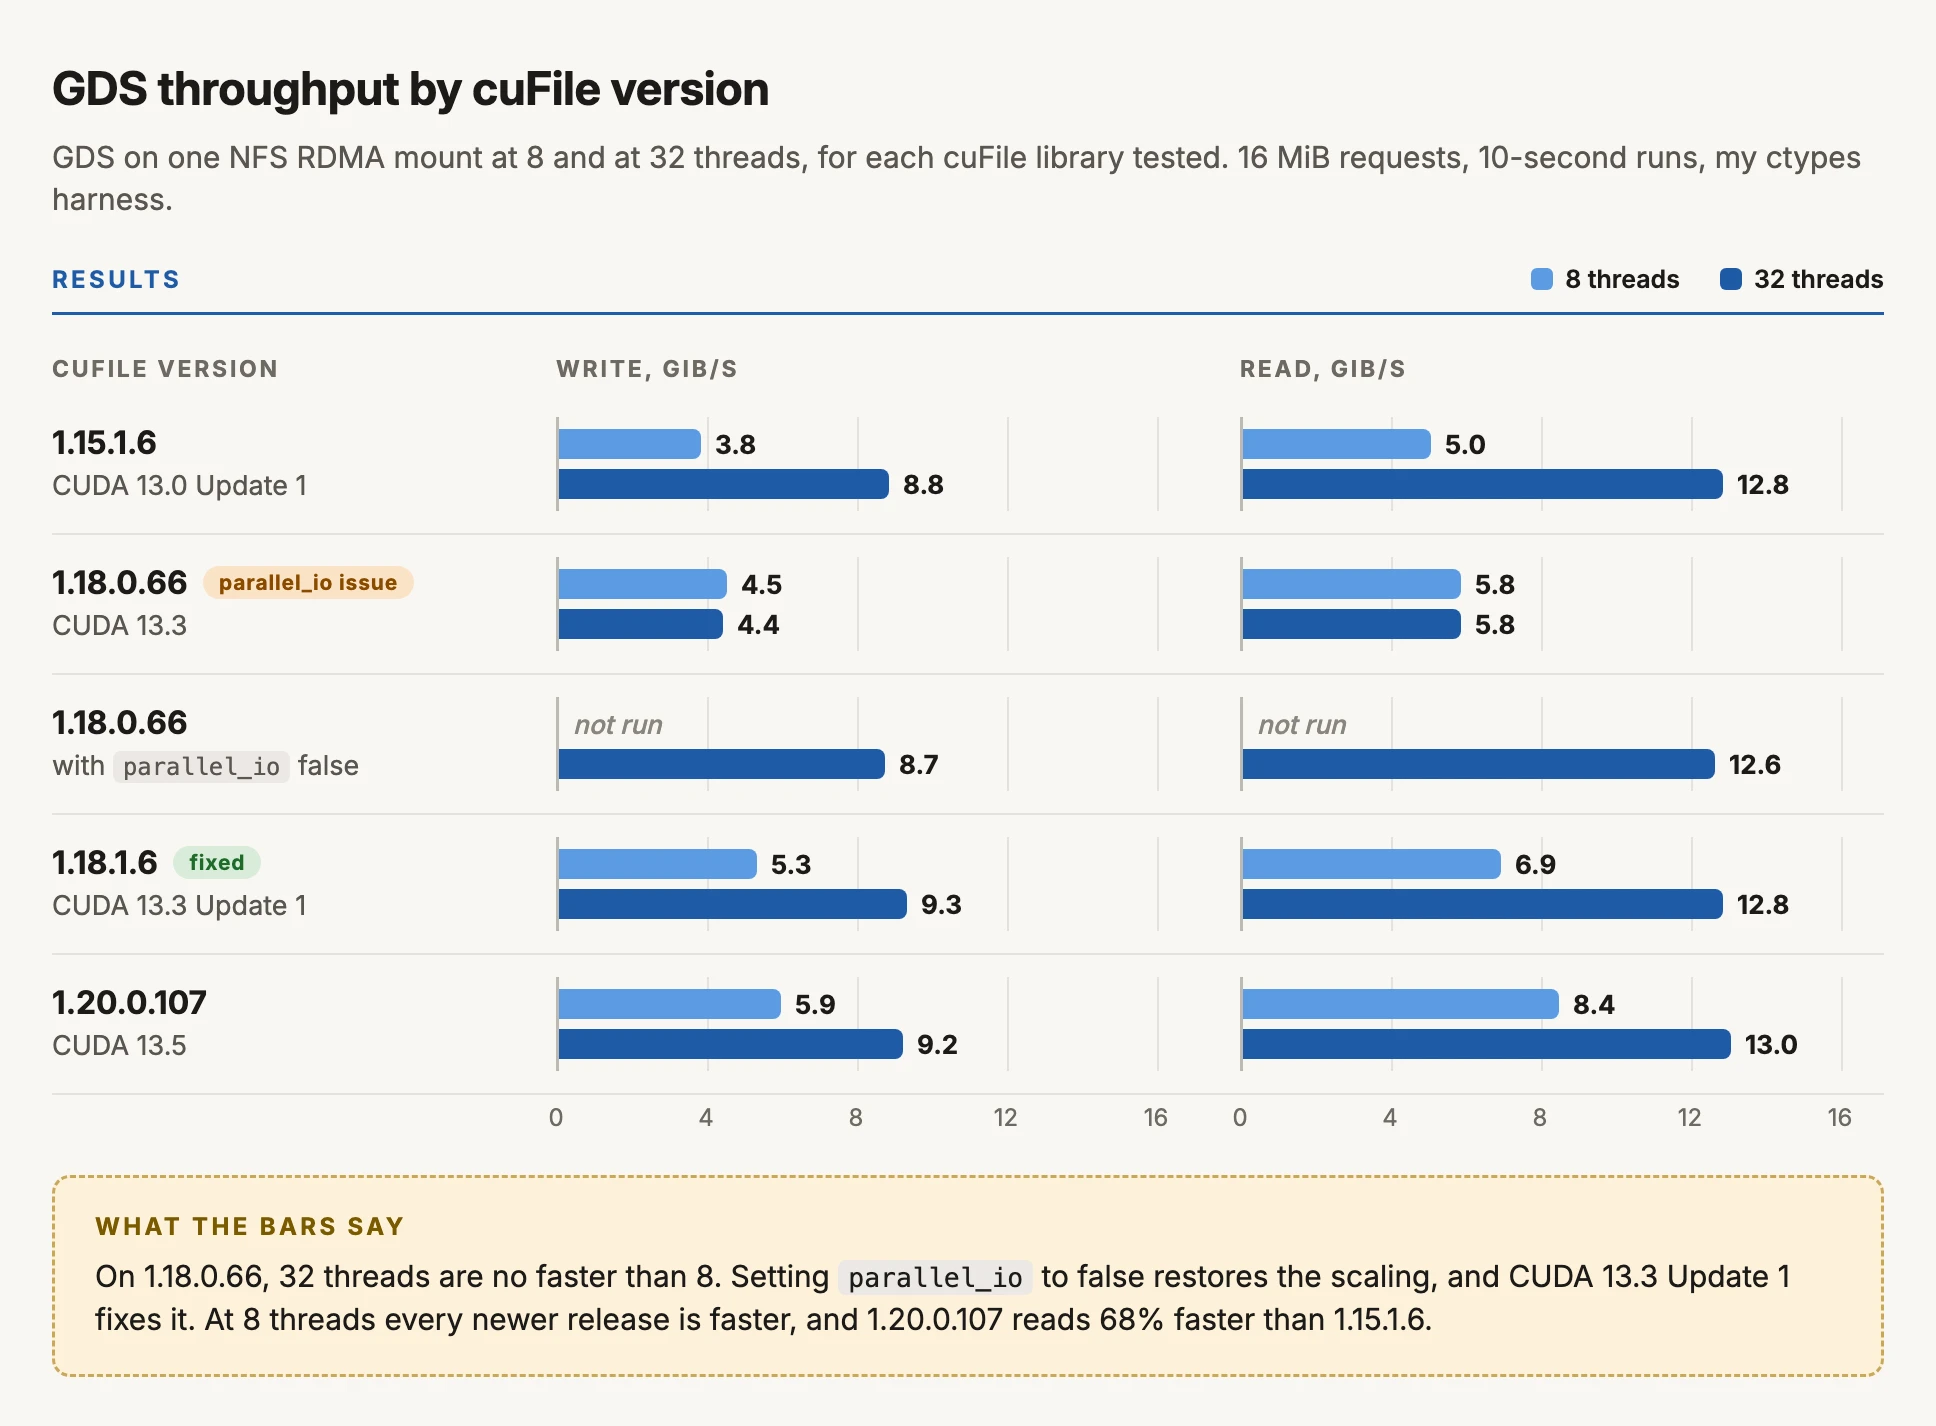
On 1.18.0.66, 32 threads are no faster than 8. Setting parallel_io to false restores the scaling, as NVIDIA predicted. Dropping to 8 MiB requests did not. From 13.3 Update 1 the issue is gone and the split of large requests works: at 8 threads, 1.20.0.107 reads 68% faster than 1.15.1.6.
The team’s diagnosis was correct for the library it described. My image carried an older one, where the limit was concurrency, and that was their broader point.
What the first post measured, and what stands
The first post measured GDS behind the host path on this mount at 8 threads, and left open whether the path from the NFS client into nvidia-fs was the ceiling. That question is now answered: the path carried 15 GiB/s in this rerun. The wider sweep shows where the gap came from: few threads, large requests, an older cuFile library and one-second runs.
What stands from the first post:
- The checks for whether GDS is really engaged: compatibility mode off, and the
nvidia-fscounters moving. - The IOMMU passthrough requirement on this hardware.
- PCIe placement not being the limit.
- The point that an application has to read through cuFile to benefit. The inference cache from the first post still does not.
The cuFile version is chosen by your framework, not by you
The thread count and request size were test parameters. The library version was not. It came with the application image, and most GDS users are in the same position.
The inference engine here is vLLM. Its 0.31 and 0.33 images both carry cuFile 1.15.1.6, and nothing in vLLM asks for that version. It arrives through the PyTorch build:
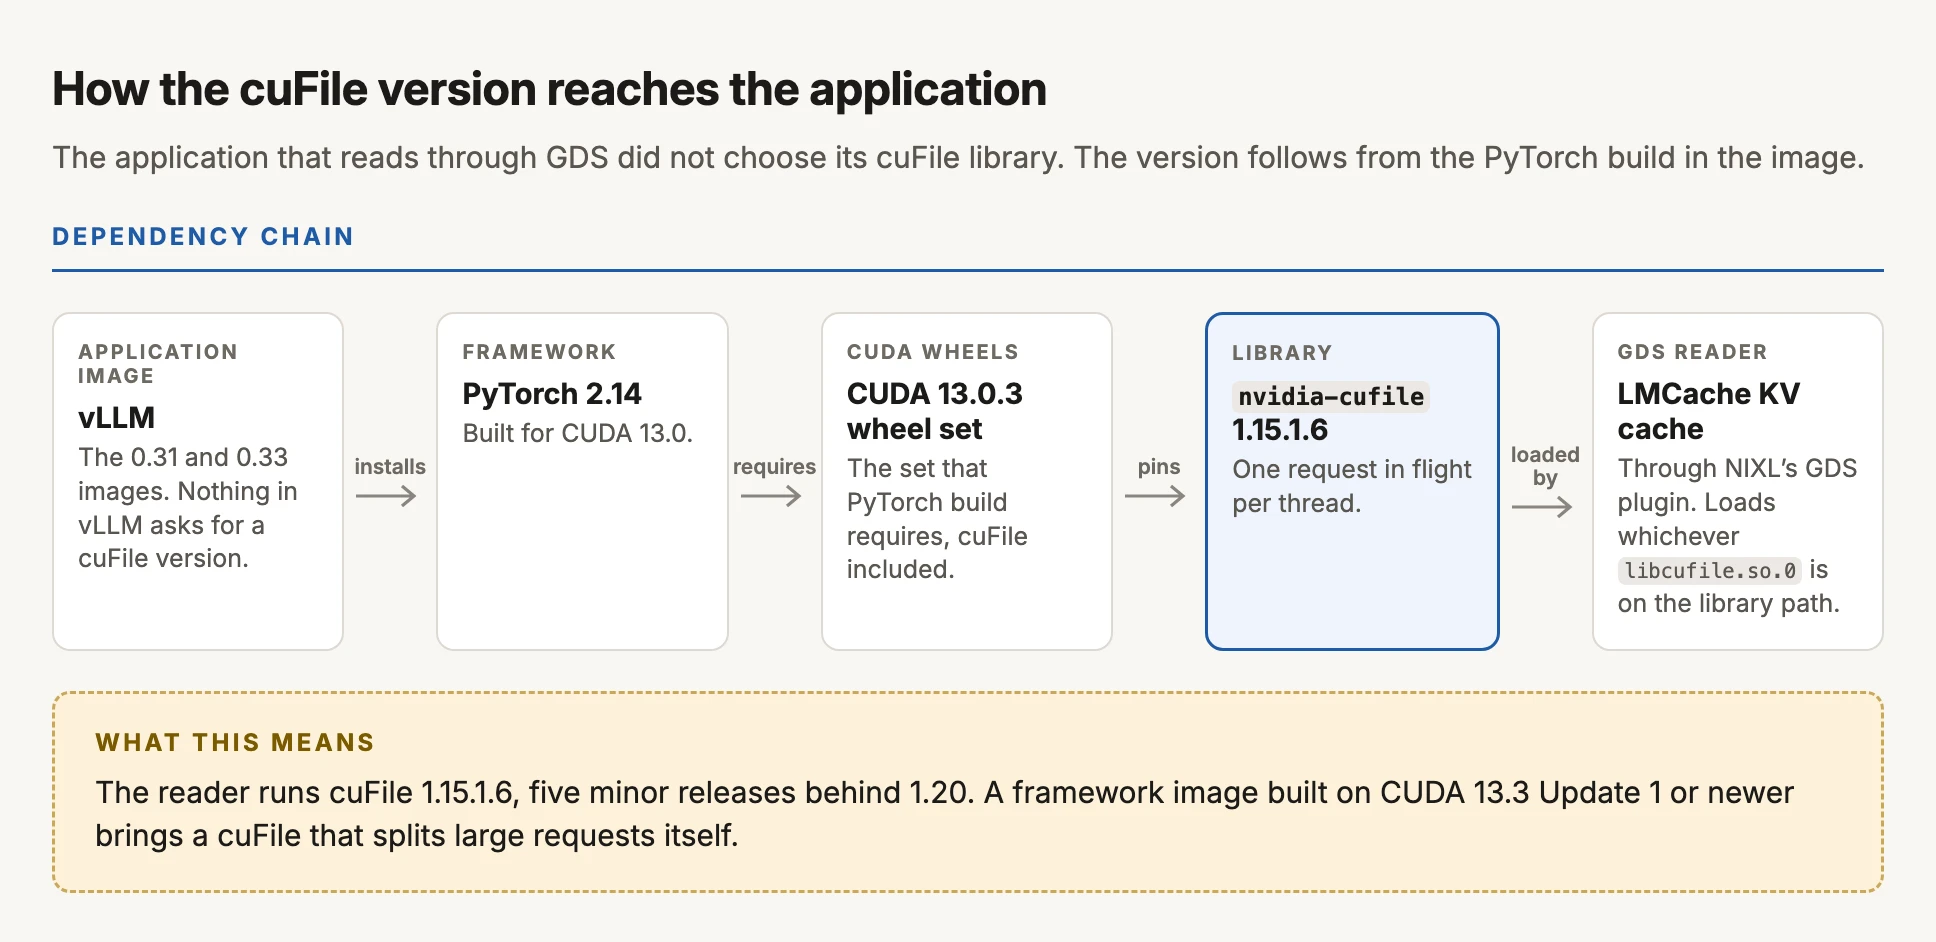
So the application that reads through GDS runs a cuFile five minor releases behind the current one, and it is the release where a thread keeps one request in flight. A reader with few threads and large requests, which is a common shape for a cache or a checkpoint loader, lands on the slow side of every table in this post.
Each step in that chain is ordinary dependency pinning. For framework and image maintainers, the effect is that the cuFile version follows the PyTorch build, so it is worth checking when GDS throughput matters.
If you are measuring or building on GDS
GDS pays off when the application keeps many requests in flight and reads through cuFile. These follow from the rerun and from what the NVIDIA team recommended.
- Read through cuFile, or GDS does nothing. An application that reads into host memory never touches the direct path. The inference cache in the first post is an example of this.
- Check the cuFile version the container ships. Run
pip show nvidia-cufileand see what requires it, before you benchmark. Prefer 1.18.1 (CUDA 13.3 Update 1) or newer, which splits large requests itself. On 1.18.0.66 (CUDA 13.3), setparallel_ioto false. A derived image with a newernvidia-cufileoverrides a pin that PyTorch set, so treat it as untested until your vendor confirms it. I have not run vLLM or LMCache that way. - Keep many requests in flight. On cuFile 1.15, one thread means one request. Plan for 16 to 32 concurrent reads or more per mount, or use a library that fans out for you. This needs no change to the image.
- With a recent library, issue large requests. The split needs something to split. At 1 MiB requests the newer library gave no gain; at 16 MiB it gave the most.
- Benchmark with matched concurrency. Match requests in flight, not threads: one cuFile thread and one
O_DIRECTthread are not the same amount of concurrency. Sweep threads to at least 32, as NVIDIA’s own reference runs do, and run each phase for 10 seconds or longer. Rungdsioand gds-diag before trusting a harness you wrote. - Prefer a supported binding to your own. NVIDIA pointed me to KvikIO for Python, which does the I/O in C++ threads. It matched my harness here, and it is less code to maintain.
gdsio, with a file and a buffer per thread, used about 3 cores at 64 threads. My harness, with one shared handle and one registered buffer, used about 22 for similar throughput. The shared handle and single buffer are the likely cause, and I have not confirmed it. - Ask about your data format. NVIDIA said they have acceleration at the HDF5 and Zarr layers that can matter more than file-level tuning. I have not tested it.
- Expect the gain at scale, not on one small reader. With few requests in flight, the host path was as fast or faster. GDS pulled ahead once the host path saturated, at 32 threads and above.
Host and mount configuration that mattered
The settings from the earlier posts still apply: IOMMU passthrough, compatibility mode off in acceptance tests only, the nvidia-fs counters as proof that bytes went direct, and an NFS client that carries the nvidia-fs hook. Three things are new from this rerun:
- Mount. NFSv3 over RDMA,
nconnect=8, 1 MiB read and write size. One mount to one storage address topped out at 14 to 16 GiB/s. Four mounts to four addresses read at up to 40 GiB/s. Giving a single mount point that rate needs a multipath mount, which I have not tested. - RoCE class. NFS over RDMA does not inherit your RDMA QoS marking. Set the RDMA connection manager’s default ToS so storage traffic lands in the lossless class.
- OFED or DOCA. Not installed here. GDS works on the in-kernel driver with the open GPU driver, but gds-diag reports it as a failure and it is not a documented combination.
Limits of this rerun
This was one GPU on one server. Apart from the four-address check, every run used one mount to one storage address. I have not repeated it on the H200 server, on a single multipath mount, or with a real training or inference workload. CPU use per GiB was about 15% lower with GDS in the gdsio runs at 32 threads, which is a small sample.
Thanks to the NVIDIA GDS team, who read the first post closely and came back within days with a hypothesis and a test plan. This rerun started from their plan.