Datrium AllFlash + Oracle measured with SLOB
Datrium is the perfect platform for running Oracle databases. Solutions can start with a single server and a single datanode and scale up to 10 data nodes and 128 servers as part of a single management domain, and single namespace.
For this test, I am using SLOB (Silly Little Oracle Benchmark) create by Kevin Closson, a tool focused on generating Oracle I/O workloads to stress the storage infrastructure.
Instead of trying to pursue complex VM and database configurations as I have seen other vendors do, I have opted for a more simplistic approach that doesn't involve dozens of disks, LUNS or in-guest iSCSI protocol, which in production environments would be difficult to support. I even dropped Oracle ASM disk groups.
VM and OS Configuration
- 32GB RAM and 12 vCPU
- Oracle 12.2.0.1 Enterprise Edition - Single Instance
- VMware ESXi, 6.7.0, 8941472
- 1 x 100GB vDISK for Linux CentOS/7
- 6 x 250GB vDISK PVSCSI w/ LVM aggregation w/ XFS for the Oracle database
- 1 Terabyte SLOB database
Hardware Configuration
- PowerEdge R930 - E7-8890 v4 @ 2.20GHz / 2016
- 8 x SATA Samsung GC57 (MZ7LM240HMHQ0D3/2016)
- 1 x Datrium Datanode F12X2 2x25G-23TB
The configurations above represent in its totality one server, one datanode, and one virtual machine. Datanodes are responsible for receiving write IOs and storing data permanently, while a copy of the data is left, in a de-duplicated and compressed form, in each server for future local data read. Further, this is an old 2016 hardware configuration, like what most organizations would already have in its data centers.
SLOB
SLOB provides a multitude of possible configurations, but I decided to use what it seems to be the most common configuration used by vendors - 70:30 Read/Write ratio, running for 2 consecutive hours.
slob.conf
 PDATE_PCT=30
 RUN_TIME=7200
 SCAN_TABLE_SZ=1M
 WORK_UNIT=64
 REDO_STRESS=LITE
 THREADS_PER_SCHEMA=1
(Update) In the original post I forgot to mention the SLOB execution config. 24 users were used to run the stress test and I used the following command: sh ./runit.sh 24
Oracle
Here are the few Oracle initialization parameters that I changed for this test. All other settings remained the same as the default installation process.
filesystemio_options=setall
db_files=2000
processes=8000
shared_pool_size=4G
db_cache_size=1536M
parallel_max_servers=0
pga_aggregate_target=9G
db_block_checksum=false
Linux Kernel
Here are the Linux kernel parameters that I changed or added for this test.
fs.aio-max-nr = 1048576
fs.file-max = 6815744
kernel.shmall = 1073741824
kernel.shmmax = 4398046511104
kernel.shmmni = 4096
kernel.sem = 250 32000 100 128
kernel.panic_on_oops = 1
net.ipv4.ip_local_port_range = 9000 65500
net.ipv4.conf.all.rp_filter = 2
net.ipv4.conf.default.rp_filter = 2
net.core.rmem_default = 262144
net.core.rmem_max = 4194304
net.core.wmem_default = 262144
net.core.wmem_max = 1048576
vm.swappiness = 0
Results
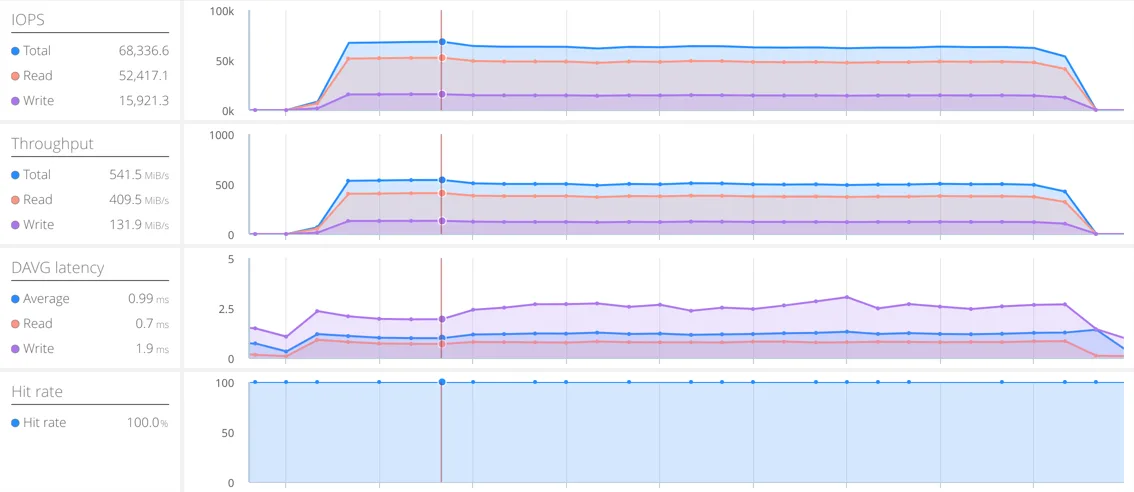
Below are the VM level metrics as seen by the hypervisor. At the peak, we saw SLOB/Oracle producing 68,336 IOPS with an average latency of 0.99ms. We also recognize that the number of IOPS is fairly constant over the two-hour runtime.
Towards the end of the workload, we also notice a couple of latency spikes, with the maximum average being only 3ms, likely when Oracle starts to pre-fetch data. I noticed that some vendors like to disable the native and hidden pre-fetch function in their tests to obtain lower latency results, but I decided to not game the numbers because this is more likely to be the real-world scenario, where pre-fetching is enabled.
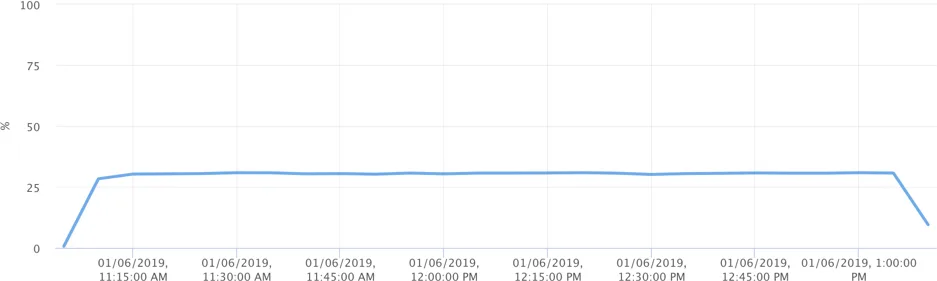
During the test, the host CPU utilization remained at only 30%, that being inclusive of both Oracle and Datrium software execution.
I am planning to run an extra SLOB test with newer hardware and better SSDs (or even NVMe) to understand how this workload would benefit – both Oracle and Datrium software are likely to improve with the added CPU and SSD performance.
Only the Beginning
To me, the most impressive isn't the number of IOPS that already beat public SLOB/HCI benchmarks I have seen online, but rather the picture below illustrating that I could add another 61 similar servers with a similar workload to the DVX system while mantaining the same performance, before I need to add another datanode. Remember, up to 10 datanodes!
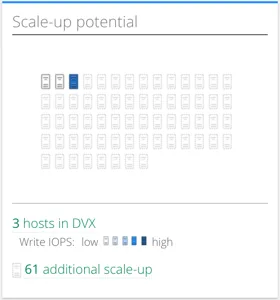
This picture demonstrates that maintaining local reads to each server and only sending write IOs to data nodes, in a north-south fashion, yields excellent advantages.
Lastly, as always, Datrium runs with all data services turned on, including Checksumming, inline Erasure Coding, inline Compression, and inline Deduplication.
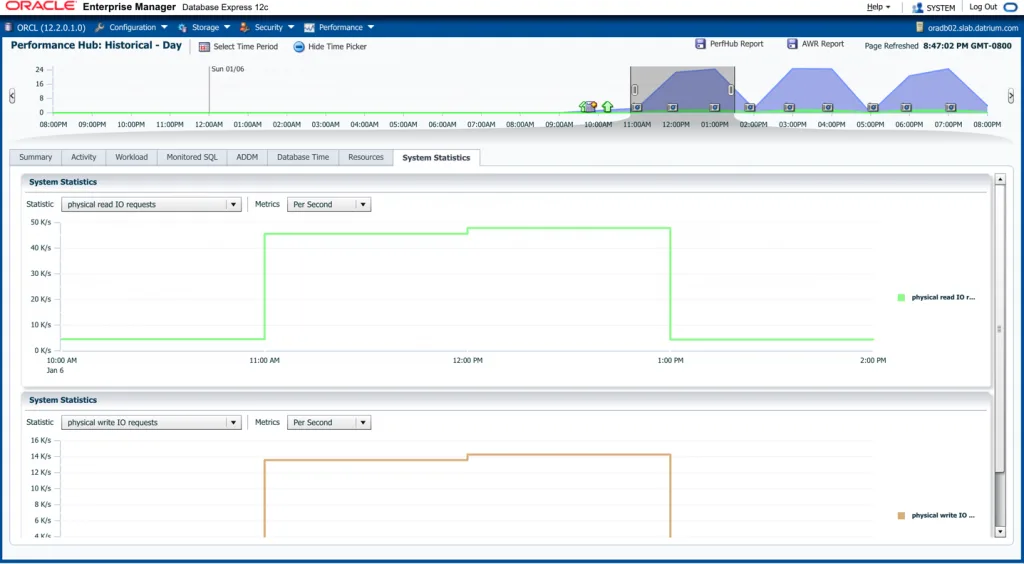
(Update) Out of curiosity I decided to run the workload with the Oracle initialization parameter db_block_checksum set to it's default option (typical). db_block_checksum determines whether DBWn and the direct loader will calculate a checksum (a number calculated from all the bytes stored in the block) and store it in the cache header of every data block when writing it to disk. The results were fairly similar, being 67,589 IOPS with an average latency of 1.0ms.